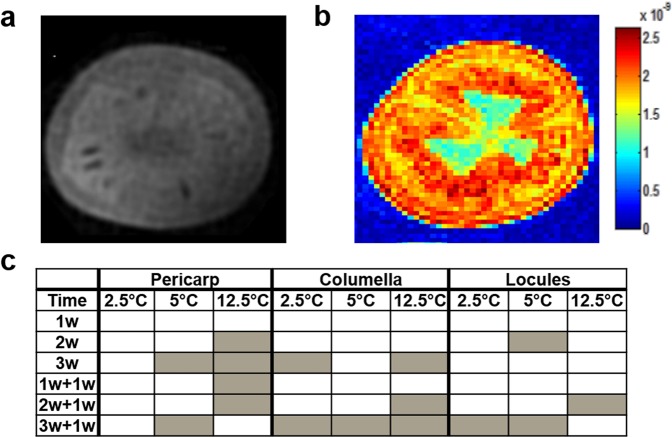
Figure 2.
MRI analysis of an equatorial slice of breaker cherry tomato fruit after cold-storage and rewarming. Fruit were kept at 2.5, 5 and 12.5 °C for 3 weeks. After 1 (‘1w + 1w’), 2 (‘2w + 1w’) and 3 (‘3w + 1w’) weeks fruit were transferred to 20 °C for 1 week. (a) MRI scan. (b) Apparent diffusion coefficient map of an equatorial slice of cherry tomato fruit. The color scale is shown in the color bar. Voxels in red and blue have high and low D-values, respectively. (c) Schematic representation of D-values measured in three fruit tissues. Values within each tissue and temperature were compared to the control which were freshly harvested fruit. Each cell represents 4 replicates, each of them containing 3 fruit. Grey color cells indicate significant differences (p < 0.05) and white cells indicate non-significant differences (p ≥ 0.05) by Dunnett’s test.

