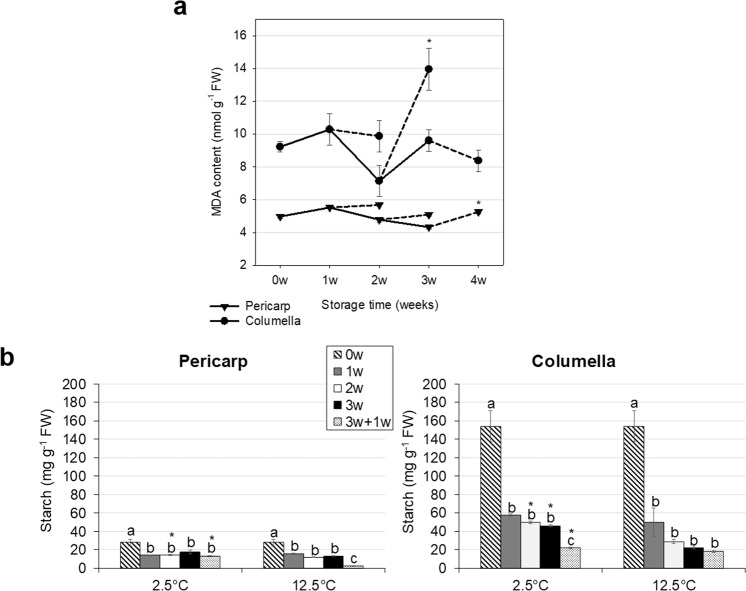
Figure 4.
Malondialdehyde (MDA) and starch contents of stored cherry tomato fruit. (a) MDA content (mean ± SE) of fruit stored at 2.5 °C, over 3 weeks. After each week of storage, fruit were transferred to 20 °C for 1 week (dashed lines). Each symbol represents the average of 8 fruit per treatment. Asterisks indicate significant differences (p < 0.05) between cold storage and the same time point followed by rewarming for 1 week by unpaired t-test. (b) Starch content (mean ± SE) of fruit stored at 2.5 °C or 12.5 °C up to 3 weeks. After 3 weeks fruit were transferred to 20 °C for 1 week (‘3w + 1w’). Each column represents the average of 6 fruit per treatment. Different letters indicate significant differences (p < 0.05) between time points at each tissue and temperature by Tukey’s test. Asterisks indicate differences (p < 0.05) between 2.5 °C and 12.5 °C at the same time point by unpaired t-test.

