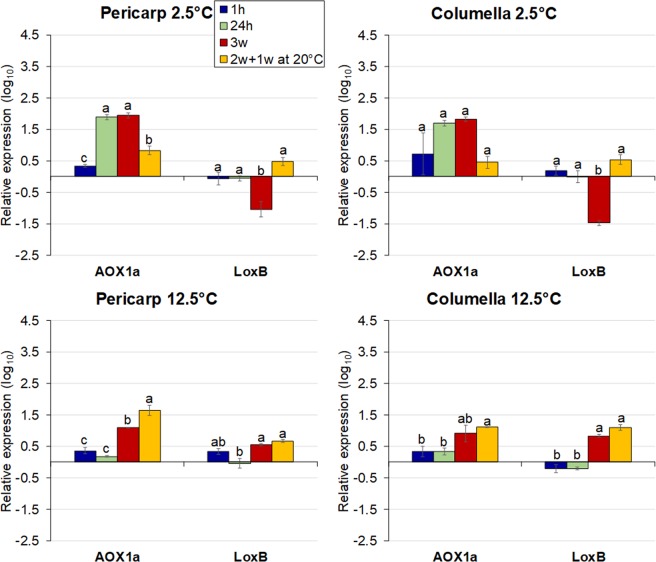
Figure 6.
Relative gene expression in the pericarp and columella of cherry tomato fruit. Fruit were stored at 2.5 or 12.5 °C for 1 h, 24 h, 3 weeks, or 2 weeks followed by 1 week at 20 °C. Freshly-harvested breaker fruit were used as the calibrator. Each symbol represents the average of 3 fruit per treatment. Values are the (log10) of the mean ± SE. Different letters indicate significant differences (p < 0.05) between time points at each tissue and temperature by Tukey’s test. Columns with asterisks are significantly different (p < 0.05) compared to the calibrator by unpaired t-test.

