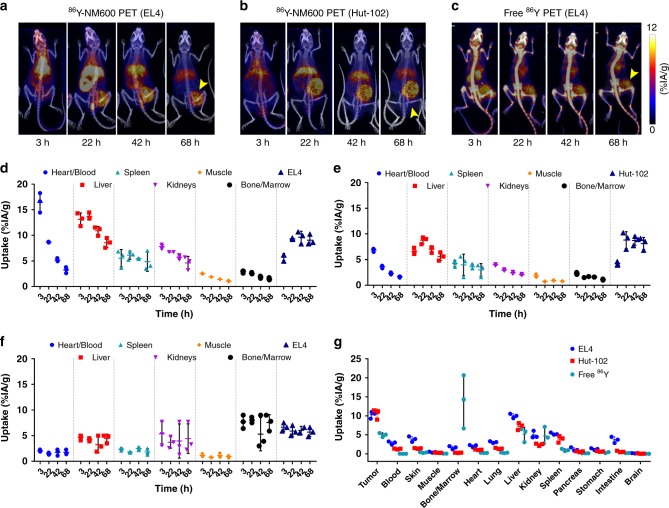
Fig. 2.
PET/CT imaging and biodistribution of 86Y-NM600 in mice bearing T-cell NHLs. Representative maximum intensity projections (MIP) of PET/CT images showing prominent and persistent tumor uptake in mice bearing EL4 (a) or Hut-102 (b) injected 9.25 MBq 86Y-NM600. Free 86Y (c) injection in EL4 bearing mice showed marked uptake in bone but lower accumulation in EL4 tumors. Yellow arrowheads point to the tumor. ROI quantitative analysis of 86Y-NM600 (d, e) and free 86Y (f) biodistribution in EL4 and Hut-102 tumor-bearing mice. g Ex vivo biodistribution was performed after the final imaging time point 68 h p.i. Numerical data are presented as %IA/g (mean ± SD)

