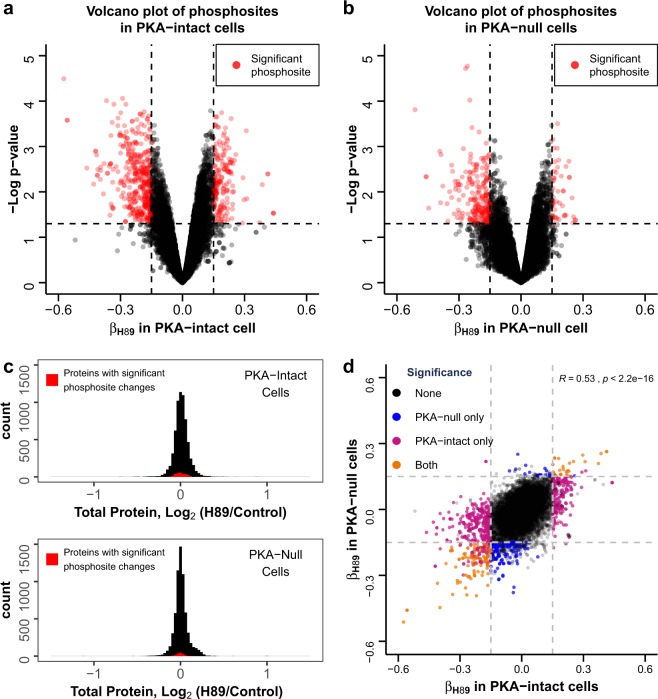
Figure 3.
Effects of H89 on phosphoproteomes of PKA-intact and PKA-null mpkCCD cells. Volcano plots show global effects of H89 on phosphoproteome of PKA-intact cells (a) and PKA-null cells (b). Each point represents a phosphosite, x-axis denotes estimated effect size of H89 (βH89; positive and negative values mean H89 treatment increases and decreases phosphorylation, respectively). Y-axis represents negative of log10 P value for βH89. Significantly changed phosphosites, determined by P value < 0.05 and |βH89| > 0.15, are colored with red. (c) Distribution of total protein abundance ratios for PKA-intact and PKA-null cells show little or no change in response to H89 treatment. (d) Correlation between βH89 in PKA-intact and PKA-null cells is observed (Pearson’s correlation R = 0.53).

