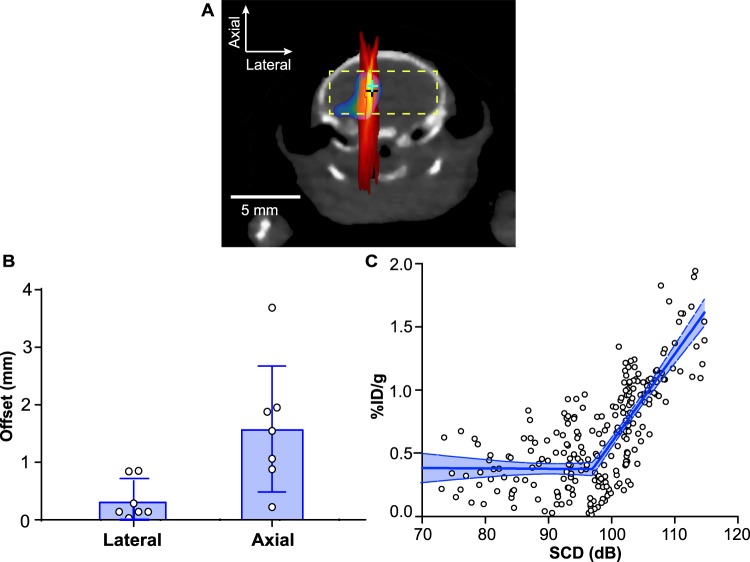
Figure 5.
Quantitative analysis of the spatial and dose correlation between SCD maps and 64Cu-AuNC concentration maps. (B) The offsets between the pixel with maximum SCD and the pixel with the maximum 64Cu-AuNC concentration (indicated by crosses in A). (C) A pixel-by-pixel correlation between SCD maps and 64Cu-AuNC concentration maps within the 2D region in the brain (indicated by the rectangular box in A). Error bar in (B) represents standard deviation. Shaded blue region in (C) represents the 95% confidence level.

