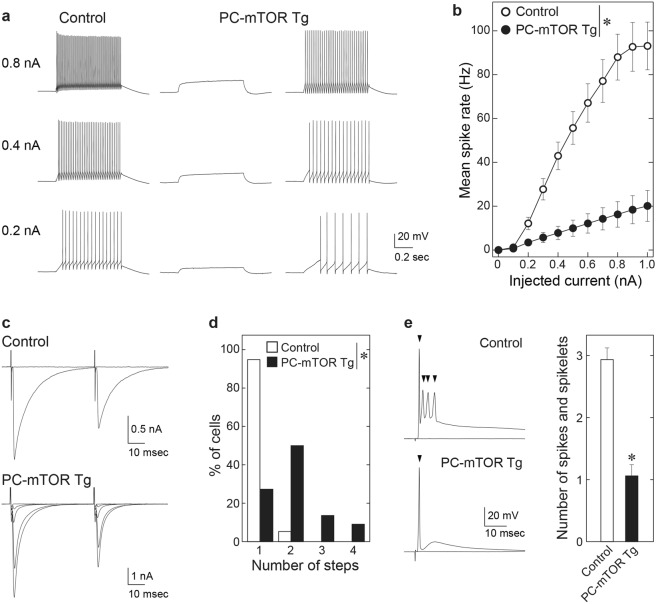
Figure 5.
Electrophysiological properties of Purkinje cells from control and PC-mTOR Tg mice. (a) Specimen traces of voltage responses to depolarizing current injection of 0.2 nA (bottom), 0.4 nA (middle), and 0.8 nA (top) recorded in a control Purkinje cell (left), a PC-mTOR Tg Purkinje cell without firing (middle) and a PC-mTOR Tg Purkinje cell generating action potentials (right). Depolarizing currents were applied from −65 mV. (b) Summary of mean spike rates in response to current commands from 0 to 1.0 nA. The firing rate was significantly lower in PC-mTOR Tg than control mice. *p < 0.001 by two-way repeated measures ANOVA; control, n = 30; PC-mTOR Tg, n = 24. (c) Specimen traces of CF-EPSCs in response to paired stimuli with 50 ms interval in a control (upper) and a PC-mTOR Tg Purkinje cell (lower). Holding potential (Vh) was −10 mV. (d) Summary histogram showing the number of discrete CF-EPSC steps in Purkinje cells from control (n = 38 cells from 4 mice) and PC-mTOR Tg mice (n = 22 cells from 3 mice) showed significant difference (*p < 0.001 by Mann-Whitney Rank Sum test). (e) CF-EPSP in a control (upper) and a PC-mTOR Tg Purkinje cell (bottom) elicited by stimulating a single CF that elicited the largest EPSCs in each Purkinje cell. Vh = −65 mV. The histograms represent the numbers of spikes and spikelets (control, n = 17; PC-mTOR Tg, n = 14). The number was significantly smaller in PC-mTOR Tg than control (*p < 0.001 by Mann-Whitney Rank Sum test; control, 2.93 ± 0.20, n = 14; PC-mTOR Tg, 1.06 ± 0.18, n = 17).

