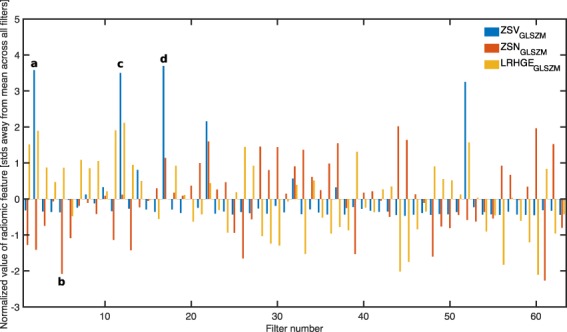
Figure 4.

Normalized value of three radiomic features of interest across 64 convolutional filters within the final convolutional layer. x-axis represents which filter within the third convolutional block. y-axis represents the value of the radiomic feature, normalized across all filters. Blue bars represent ZSVGLSZM, red bars represent ZSNGLSZM and yellow bars represent LRHGEGLRLM. Of particular interest are the numerous blue peaks (a, c and d). These filters are strongly activated by an input region with a high value of the radiomic feature ZSVGLSZM, precisely the feature that Vallières et al.25 found to be most predictive. Many of these filters are also strongly activated by extreme (high or low) values of ZSNGLSZM and LRHGEGLRLM (red and yellow respectively). In particular, many filters represent various permutations of the three features. As an example, (a) is activated by all three radiomic features, (b) is mostly activated by red, (c) is mostly activated by blue and yellow, while (d) is mostly activated by blue. The lettering scheme corresponds to the maximal activation maps shown in Fig. 3.
