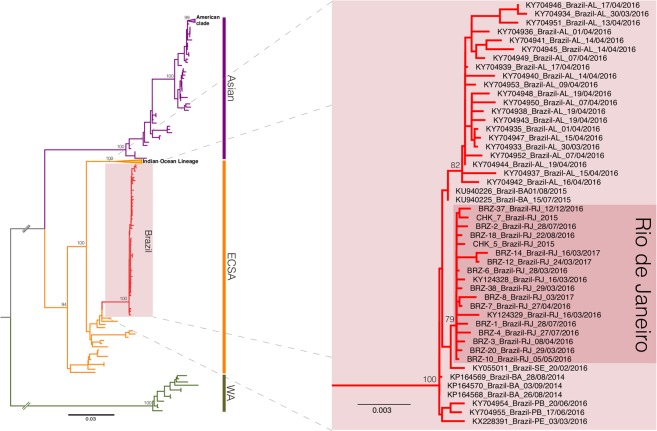
Figure 2.
Maximum likelihood phylogeny of the CHIKV full-length genome dataset. The bootstrap values are indicated for each genotype-specific clade (vertical bars, ECSA: East-Central-South African, WA: West African) and important intra-genotype lineages (Asian: American and ECSA: Indian Ocean Lineage and Brazil). The inset offer a close view of the ECSA genotype clade showing the Brazilian cluster (pink box) and the inner Rio de Janeiro cluster (red box). The branch lengths are drawn to scale with bar at the bottom indicating nucleotide substitutions per site.

