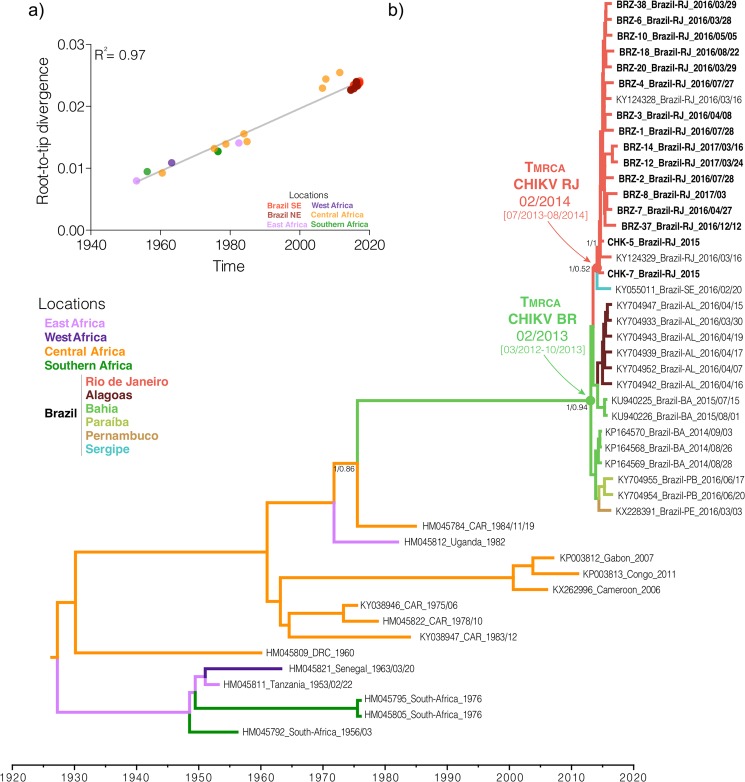
Figure 3.
Phylogeography of the CHIKV ECSA genotype. (a) Temporal signal analysis correlating the sampling date of each sequence and its genetic distance from the root of a maximum likelihood phylogeny (R2 = 0.97). (b) Time-scaled Bayesian phylogeographic MCC tree of the CHIKV ECSA genotype full-length genomes. The colors of branches represent the most probable location of their descendent nodes as indicated at the legend (bottom right). Branch support are indicated only at key nodes (posterior/posterior state probability). The nodes representing the ECSA introduction in Brazil (red dot) and Rio de Janeiro (green dot) are indicated. All horizontal branch lengths are drawn to a scale of years. Tips names were coded as accession number_country_date. (AL: Alagoas state, BA: Bahia state, PA: Paraiba state, PE: Pernambuco state, RJ: Rio de Janeiro state, SE: Sergipe state; CAR: Central African Republic; DRC: Democratic Republic of Congo; USA: United States of America).

