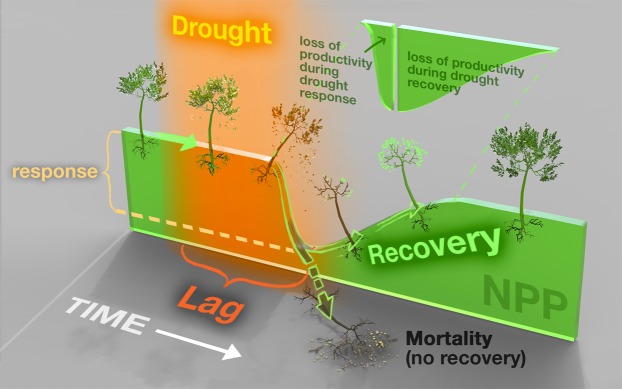
Figure 1.
Schematic depicting how severe drought can impact NPP. Starting on the left, with time progressing to the right, this example ecosystem begins at typical vegetation growth rates (the height of the green surface). Drought (the orange shaded period) can decrease productivity even after the return to nominal climate conditions. Drought response is the initial depression in growth following the onset of a drought, indicated here as the depth of the trough in NPP. Lag time is the time between the onset of drought and the drought response. Recovery describes the amount of time required to recover normal growth rates. Drought legacy effects correspond to the magnitude of NPP depression during drought recovery. The cut-out wedge illustrates the total loss of NPP, relative to typical productivity - during the drought event itself and through the end of drought recovery. Alternatively, vegetation may be unable to recover from drought and, instead, follow the path to mortality. Note that the relative magnitudes of these variables (e.g. larger cumulative loss of productivity during drought recovery than the drought response) depend on factors such as the drought’s characteristics and the type of vegetation; this illustration provides an example of drought’s impact on productivity rather than the rule. Illustration by Victor O. Leshyk. Printed with permission by Victor O. Leshyk under a CC BY open access license (https://creativecommons.org/licenses/by/4.0/).

