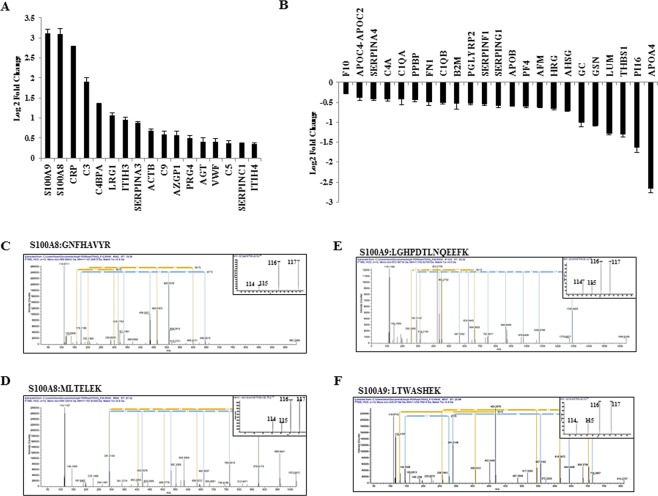
Figure 2.
Proteins with differential abundance in GBM serum identified by iTRAQ. (A,B) Log2 transformed ratios for proteins with at least two unique peptides having high abundance and low abundance, respectively, in GBM sera as compared to control sera are shown. (C,D) Representative tandem mass spectrometry (MS/MS) spectra for peptide sequence GNFHAVY and MLTELEK derived from S100A8. iTRAQ label 114 and 115 were used for control pooled serum sample and 116 and 117 were used for GBM pooled serum sample. (E,F) Representative tandem mass spectrometry (MS/MS) spectra for peptide sequence LGHPDTLNQEEFK and LTWASHEK derived from S100A9. iTRAQ label 114 and 115 were used for control pooled serum sample and 116 and 117 were used for GBM pooled serum sample.

