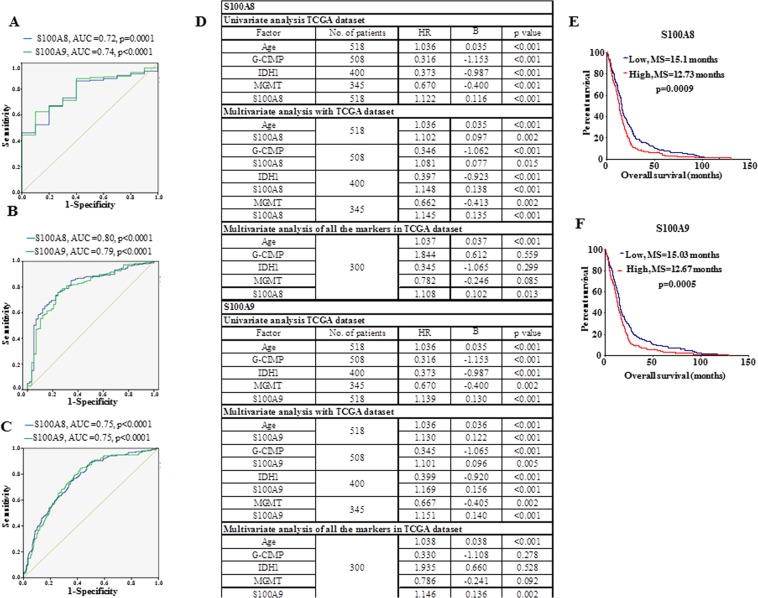
Figure 5.
S100A8 and S100A9 transcripts are diagnostic and poor prognostic markers for GBM. (A) ROC curve depicting transcript levels of S100A8 and S100A9 discriminate between control and GBM, AUC and p value is indicated. (B) ROC curve depicting transcript levels of S100A8 and S100A9 discriminate between grade III and GBM, AUC and p value is indicated. (C) ROC curve depicting transcript levels of S100A8 and S100A9 discriminate mesenchymal subtype from other GBM subtypes, AUC and p value is indicated. (D) Univariate and Multivariate cox proportional hazard regression analysis was performed using TCGA Affymetrix data for transcript levels of S100A8 and S100A9 along with age, G-CIMP status, IDH1 mutation status, MGMT promoter methylation status. (E,F) Kaplan Meier survival analysis using TCGA Affymetrix cohort (n = 518) for transcript levels of S100A8 and S100A9. Log-rank (Mantel–Cox) test was applied and the p value is indicated.

