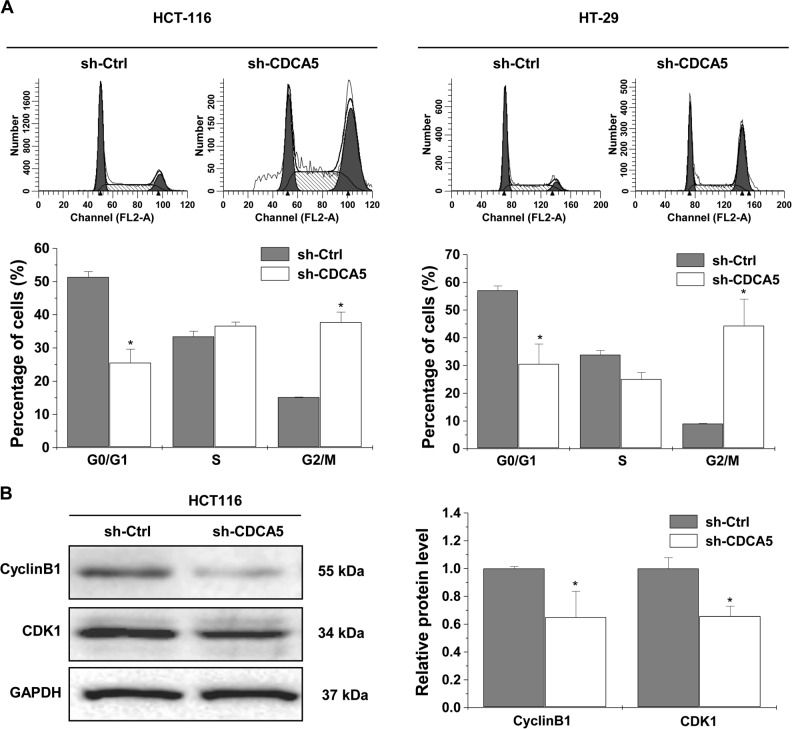
Fig. 4. CDCA5 knockdown induces cell cycle arrest.
a Cell cycle distribution was determined by flow cytometric analysis in HCT116 (left panel) and HT-29 cells (right panel) after CDCA5 knockdown. The percentage of cells in the G0/G1, S, and G2/M phases was calculated. *P < 0.05 vs. sh-Ctrl. b Western-blot analysis of CDK1 and CyclinB1 in HCT116 cells after transduction with sh-CDCA5 or sh-Ctrl lentivirus. The integrated band density was determined by ImageLab Software, and GAPDH as the internal control (*P < 0.05). All experiments were performed in triplicate

