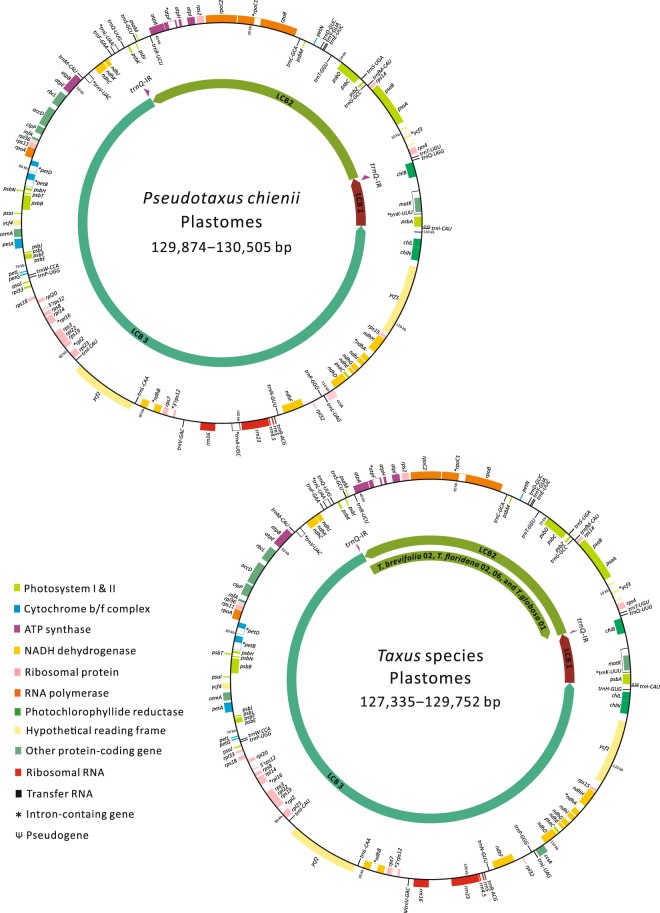
Figure 1.
Circular maps of Pseudotaxus and Taxus plastomes. Colored boxes outside and inside the circle are genes in counterclockwise and clockwise transcribed directions, respectively. Locally co-linear blocks (LCBs 1, 2, and 3) between Pseuodtaxus and Taxus are indicated by the inner colored arrows with their relative orientations. Regions of trnQ-IRs are denoted by purple arrows along LCBs. Scale bars 10 kb in length are given with psbA as the starting point.

