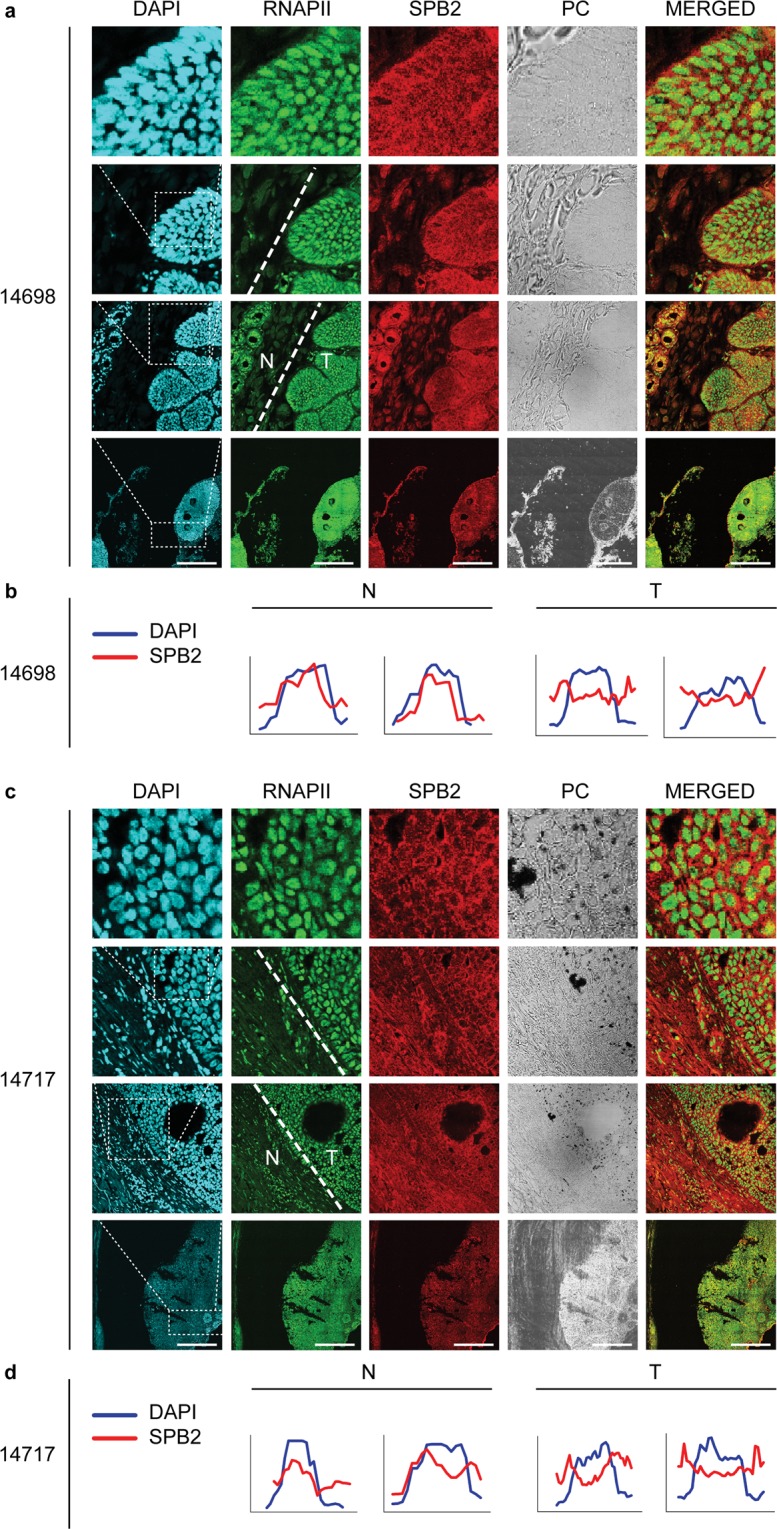
Figure 5.

Subcellular localization of SPB2 in the normal and tumorous part of human skin tissues: (a,c) co-immunostaining with RNA Polymerase II (RNAPII) (green) and SPB2 (red) in normal and in basal cell carcinoma tissues. PC represents the phase contrast images. The N and T represent the normal and the tumorous part of the tissue, respectively. DAPI (blue) was used to visualize nuclei. Scale bars represent 180 µm (b,d) Quantitative evaluation of fluorescent intensity obtained from normal (N) and tumorous (T) part of the represented tissues. The data obtained from DAPI signal is indicated in blue, while SPB2 signal is shown in red. In each graph DAPI (blue) represents the nuclei. In the cases, when graphs of pixel intensities of DAPI and SPB2 were correlated to each other, the SPB2 showed nuclear localization (b normal samples). The inverse correlation of DAPI and SPB2 graphs reflects that SPB2 localizes in the cytoplasm (d tumorous samples).
