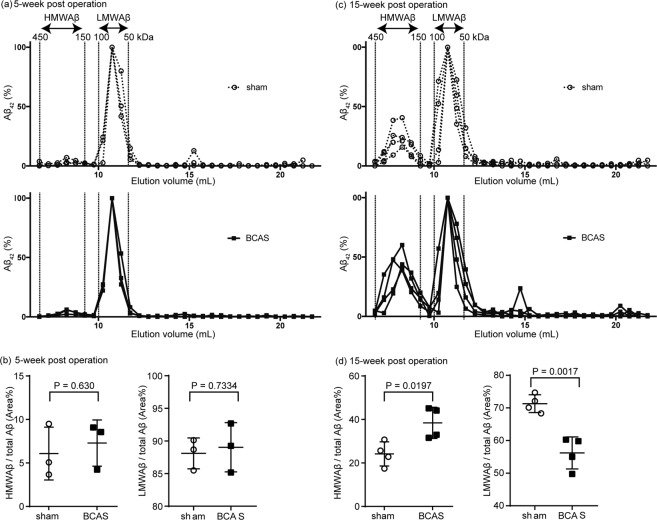
Figure 2.
BCAS increased Aβ oligomers with high molecular weight. (a,c) Size exclusion chromatography of PBS-soluble Aβ42 from brain homogenate at week 5 and 15 post-operation. The concentration of Aβ42 was measured by ELISA, and normalized to peak-concentration of low molecular weight Aβ = 100%. The molecular size of each fraction was determined by comparison with a molecular size marker. (b,d) The percentage of high and low molecular weight species in the total amount of Aβ42 was determined as the area under the curve. Comparisons between groups were performed by using Student t-test. n = 4 per group.

