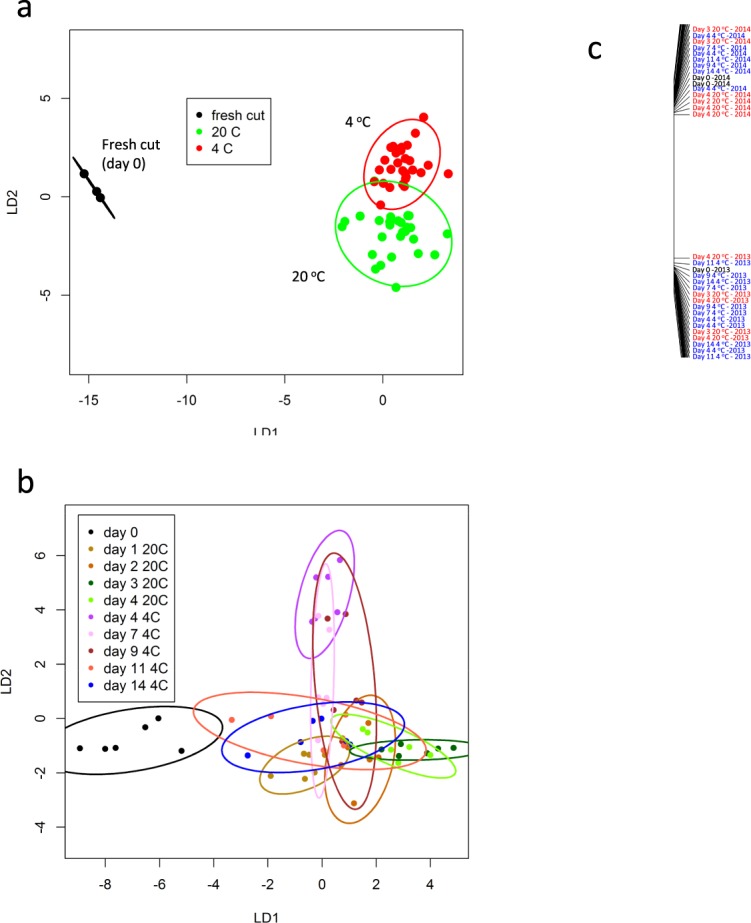
Figure 3.

Canonical Analysis of Principal coordinates related to temperature and time of storage based on all VOCs combined from 2013 and 2014 melon using TD-GC-TOF-MS: A CAP model was produced for melon samples (a) temperature of storage at 4 °C and 20 °C, (b) days and storage at 4 °C and 20 °C into a single sample category and (c) season. Each ellipse represents the 95% confidence interval. The plots use LD1 and LD2 (a) with a percentage of correct classification of 96.7% (n = 3 for fresh, n = 12, for 20 °C, n = 15 for 4 °C), (b) with a percentage of correct classification = 48.3% (n = 3) and LD1 for (c) with a correct classification of 100% (n = 30).
