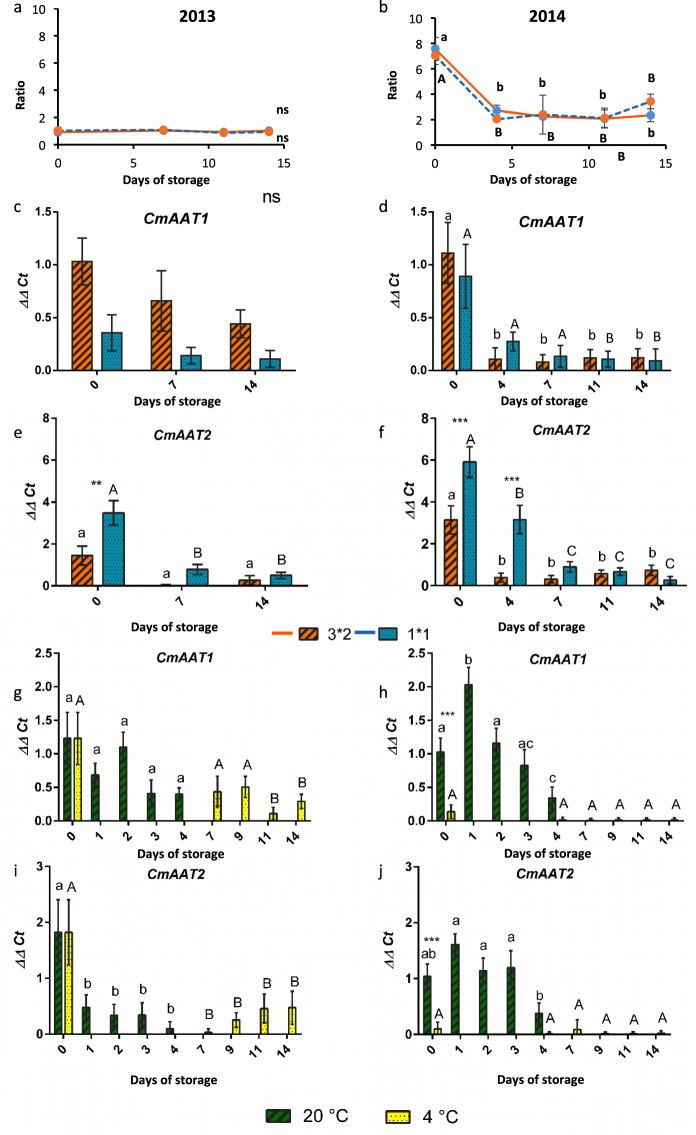
Figure 4.
Changes in gene expression of genes related to ester biosynthesis over storage time and temperature, cut size, and across the two seasons. (a,c,e,g,i) 2013 and (b,d,f,h,j) 2014. (a–d) Compare cut size (small and large) (e–h) compare storage at two temperatures (4 °C and 20 °C); (a,b) ratio of acetate to non-acetate esters in total VOC profile for each time point; (c,d,g,h) expression of alcohol acetate transferase (AAT1), (e,f,i,j) expression of alcohol acetate transferase (AAT2); n = 3 bars indicate ± SE. Asterisks denote significant differences between the two cut sizes at each time point: *P < 0.05, **P < 0.01, ***P < 0.001; different letters above bars indicate differences across time points (uppercase for large 3 × 2 cm (L) and lower case for small 1 × 1 cm (S) cut sizes); ns indicates that there were no significant differences across any of the time points or cut sizes.

