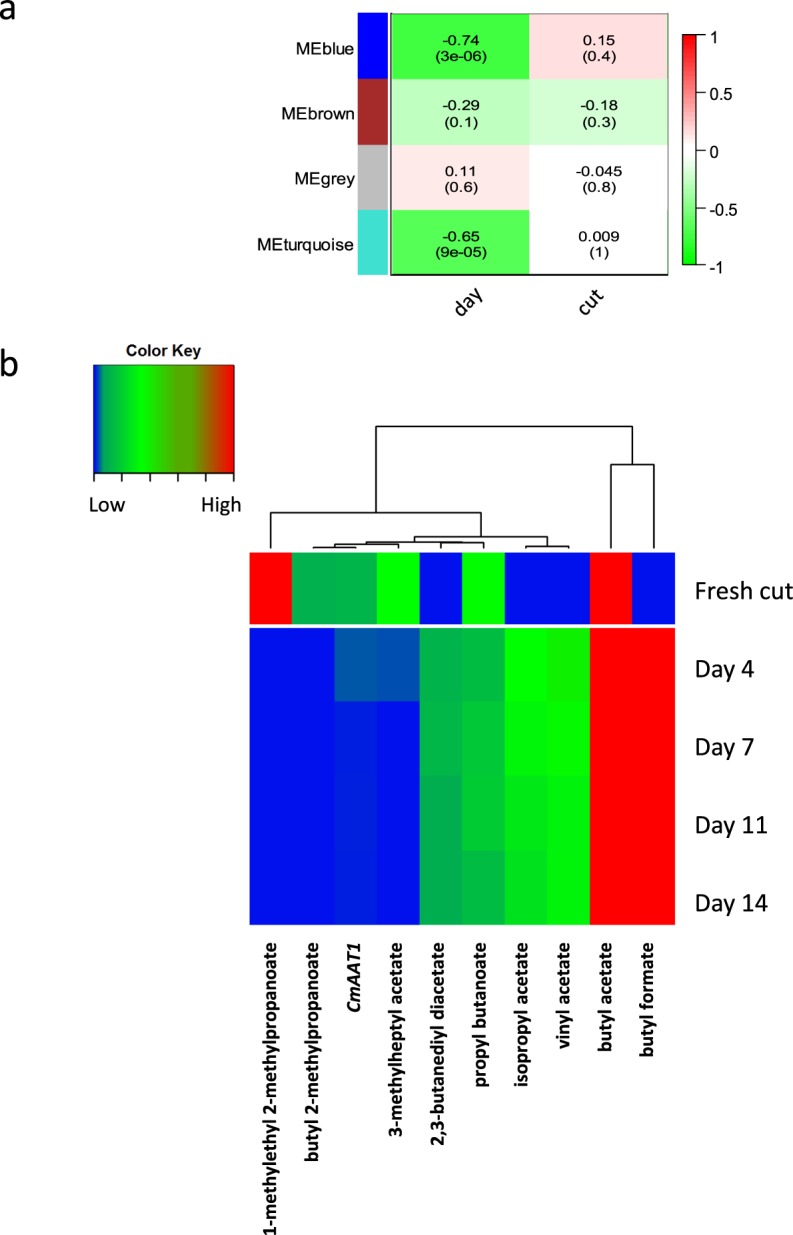
Figure 5.

Multi-trait correlation analysis of all ester VOCs and gene expression of genes related to ester biosynthesis, CmAAT1 and CmAAT2 during the 2014 cut size experiment: (a) WCNA modules where score and significance (as P values in brackets) in relation to the traits (days of storage and cut size) are from a Pearson analysis based on WCNA soft-thresholding power = 8 and Module size = 4; (b) Multi-trait analysis heat map and hierarchical clustering based on day of storage using VOCs grouped into the Turquoise module in (a) and which were significantly correlated with days of storage. Blue indicates low, green intermediate and red high abundance of the character (transcript or VOC).
