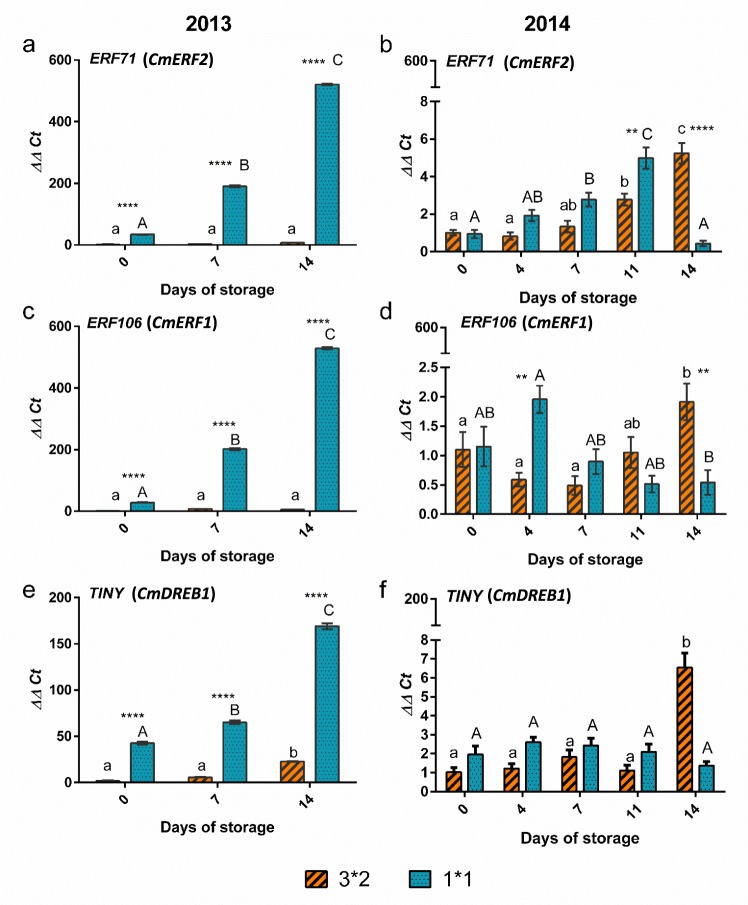
Figure 6.
Changes in gene expression of ERF and TINY transcription factors over storage time with cut size and across the two seasons. ERF71 (a) 2013 (b) 2014; ERF106 (c) 2013 (d) 2014; TINY (DREB) (e) 2013, (f) 2014. n = 3 bars indicate ± SE. Different letters indicate statistically significant differences among different days of storage (P < 0.05). Asterisks denote significant differences between the two cut sizes (large, L and small, S): *P < 0.05, **P < 0.01, ***P < 0.001.

