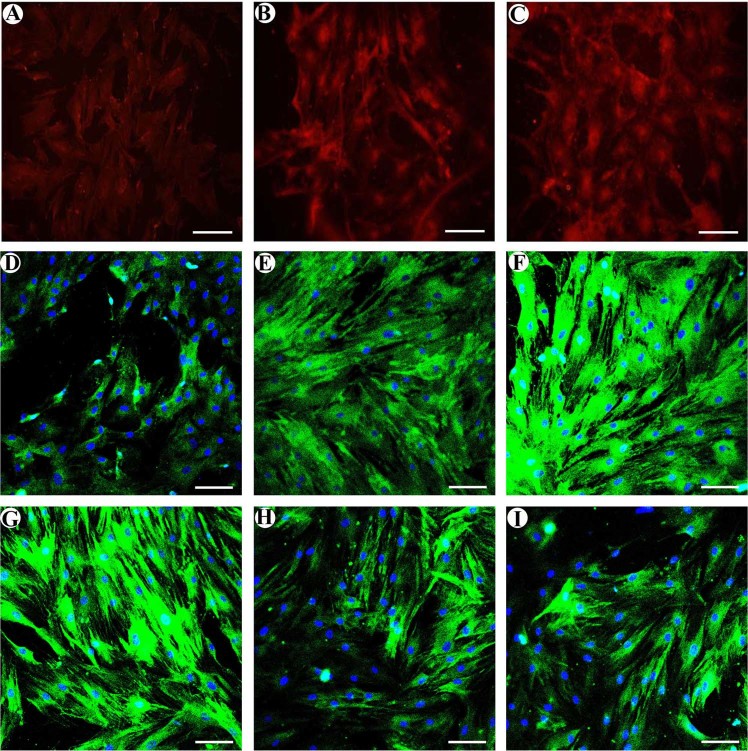
Fig. 2. Immunofluorescent staining.
MSCs were stained with β-catenin (red), FZD1 (green) and DKK1 (green) antibodies (green), and the cells were co-stained with DAPI to indicate the nuclei (blue). a–c β-catenin showed obviously weak staining in the ONFH group. Following treatment with 5′-Aza-dC, β-catenin staining was obviously increased but was still weaker than that of the control group. d–f FZD1 showed obviously weak staining in the ONFH group. Following treatment with 5’-Aza-dC, FZD1 staining was obviously increased but was also weaker than that of the control group. g–i Dkk1 had strong staining in the ONFH group. Treatment with 5′-Aza-dC obviously decreased Dkk1 staining. The control group had weak Dkk1 staining (bars 50 μm)

