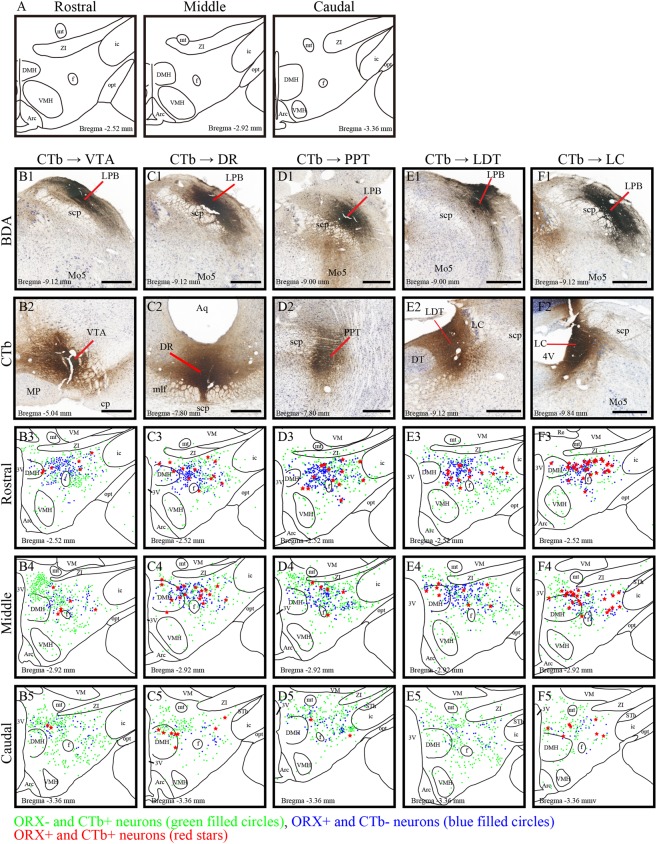
Figure 2.
Distribution of ORX-immunoreactive (IR) neurons projecting to the brainstem arousal areas. (A) Schematic drawings of three sections which represent the approximate posterior levels to bregma −2.54 mm (rostral), −2.92 mm (middle) and −3.36 mm (Caudal). (B) Photomicrographs showing the injection sites of BDA into the LPB (B1-F1) and CTb into the VTA (B2), DR (C2), PPT (D2), LDT (E2) and LC (F2). (B3- F5) Line drawings showing the distribution of CTb-IR neurons (green filled circles), ORX-IR neurons (blue filled circles), and ORX and CT- double-IR neurons (red stars) in the three regions of hypothalamus. The distance (mm) behind the bregma is noted at the bottom. Scale bars, 500 μm. CTb; cholera toxin b subunit; ORX: orexin; IR: immunoreactive; VTA: ventral tegmental area; DR: dorsal raphe; PPT: pedunculopontine nucleus; LDT: laterodorsal tegmental nucleus; LC: locus ceruleus; BDA: biotinylated dextranamine.

