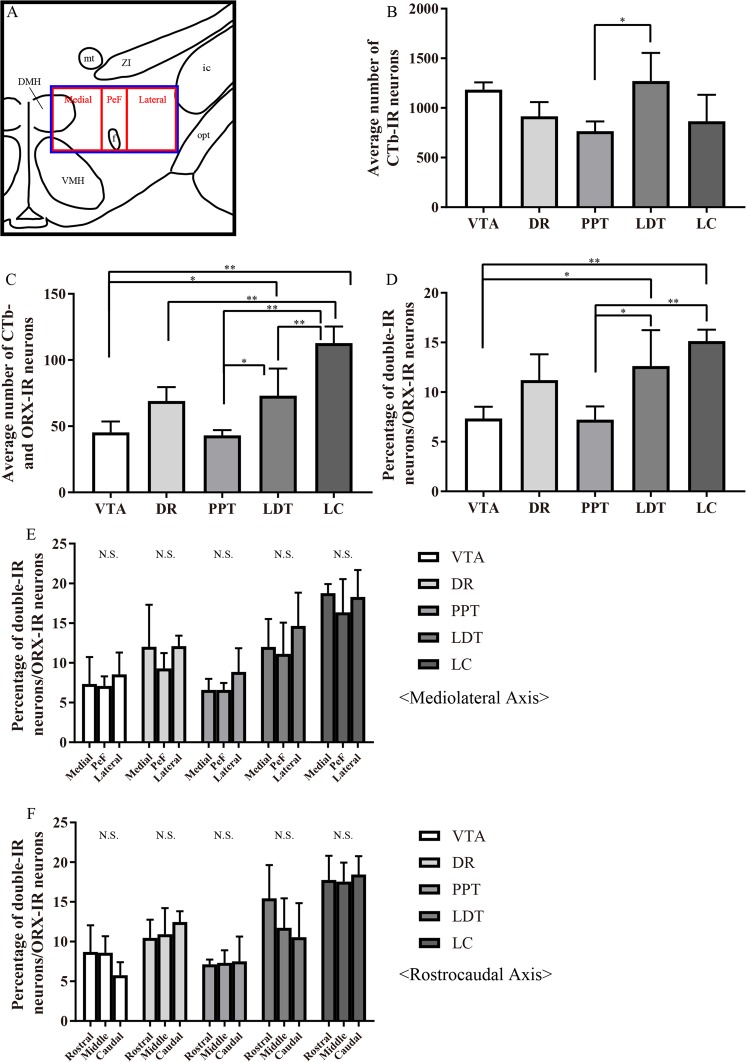
Figure 3.
Abundant innervation of hypothalamic orexin neurons to LC. (A) Schematic drawing showing arbitrarily divided three regions of the hypothalamus. Blue square shows ORX field and this square is divided to three regions, medial, PeF, and lateral. (B–D) Quantification of the average number of CTb-labeled neurons (B), ORX-IR neurons and CTb-labeled neurons (C), and the percentage of ORX and CTb double-IR neurons in ORX-IR neurons (D) in the ORX field. *P < 0.05, **P < 0.01, (n = 4, 6 sections from each rat. one-way ANOVA followed by Tukey–Kramer test) (E and F) Quantification of the percentage of ORX and CTb double-IR neurons in ORX-IR neurons after an injection of CTb into the VTA, DR, PPT, LDT or LC. Cells were quantified in three rectangles, medial, PeF and lateral regions across mediolateral axis, and rostral, middle and caudal rectangles in the ORX field of the hypothalamus across the rostrocaudal axis and compared among samples. N.S.; not significantly different. PeF: perifornical area; CTb; cholera toxin b subunit; ORX: orexin; IR: immunoreactive; VTA: ventral tegmental area; DR: dorsal raphe; PPT: pedunculopontine nucleus; LDT: laterodorsal tegmental nucleus; LC: locus coeruleus.

