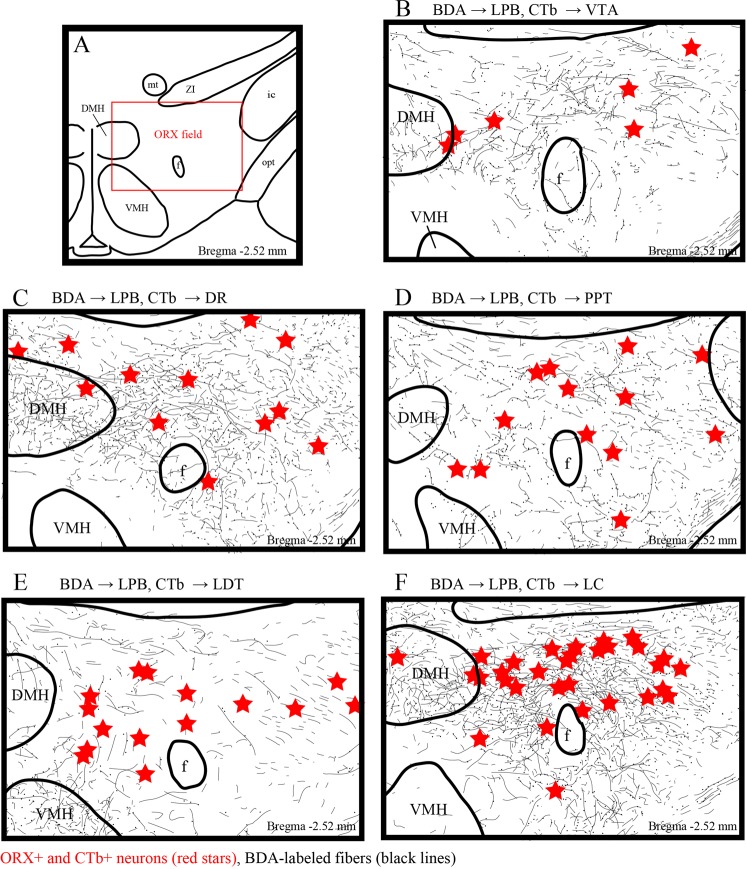
Figure 4.
Distribution of LPB axons and ORX and CTb double-IR neurons in the ORX field. (A) Schematic drawing shows the ORX field. The distance (mm) behind the bregma is noted at the bottom right. (B–F) Line drawings showing the distribution of BDA-labeled axons (black line), and ORX and CTb double-IR neurons (red stars) in the hypothalamus. The distance (mm) behind the bregma is noted at the bottom right. LPB: lateral parabrachial nuclei; ORX: orexin; CTb: cholera toxin b subunit; BDA: biotinylated dextranamine.

