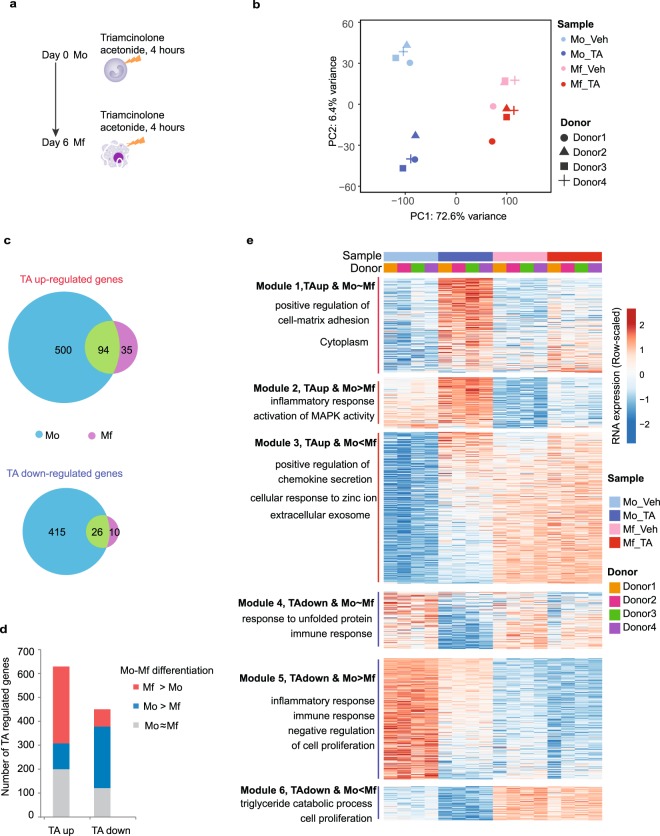
Figure 1.
Transcriptomic impact of glucocorticoids on Mo and Mo-derived Mf. (a) Outline of the experiments performed in this study. Either freshly purified healthy donor monocytes (Mo) or the monocyte-derived macrophages obtained upon 6 days of in vitro differentiation (Mf) were exposed to 0.1% DMSO vehicle or 1 μM TA dissolved in DMSO for four hours. (b) Principal component analysis based on log2 normalized RNA-seq counts of the 5000 most variable genes using 16 samples derived from 4 donors. The shapes of the symbols indicate donors, colours indicate cell types and a darker shades indicates TA-treatment. (c) Venn diagram representations of the TA up- and TA down-regulated genes in Mo and in Mf. (d) Stratification of TA up- and down-regulated genes as a function of their relative activity in Mo and Mf. (e) Statistically significant transcripts up-regulated two-fold or more are plotted for each of the six combinatorial clusters shown in (d). Colouring is relative to the average of the 16 samples analysed in the four blood donors’ cells. Representative gene ontology biological processes are indicated for each cluster.

