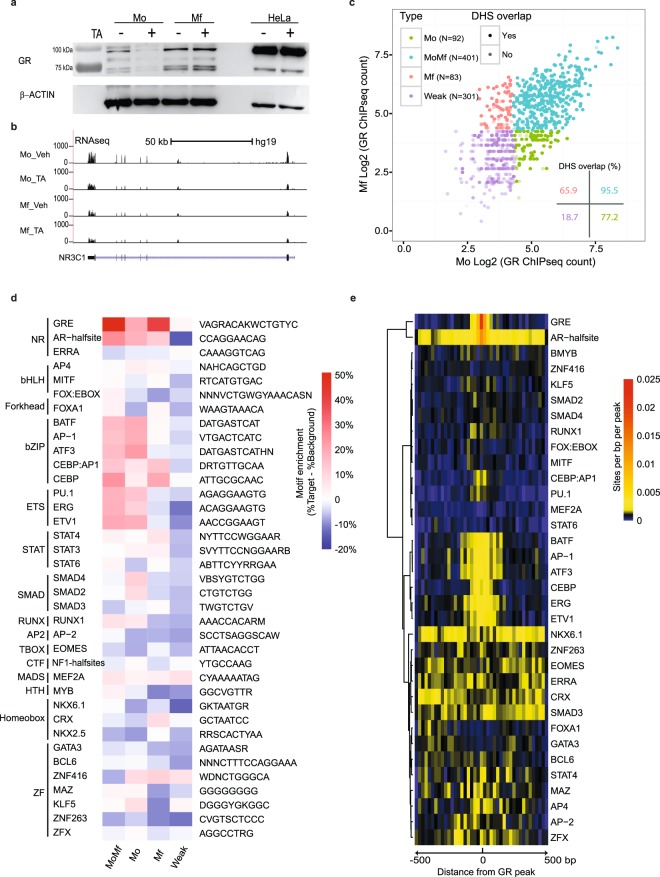
Figure 3.
Genome-wide GR localisation patterns and underlying TF motif analysis. (a) Glucocorticoid receptor (GR) protein levels in Mo and Mf, treated or not with 1 μM TA for 4 hours. Beta-actin was used as internal loading control antigen. (b) RNA-seq signal at the NR3C1 gene, which codes for GR, in Mo and Mf exposed for four hours to TA. (c) GR ChIP-seq signal intensity in Mo and Mf at 877 high confidence GR ChIP-seq peaks was used to define four sets of GR peaks (MoMf, Mo, Mf and ‘Weak’). Overlap with a previously determined set of Mo and Mf DHS43 is indicated by darker shading. The inset indicates the percentage of peaks that overlap with these DHS. (d) Enriched motifs in the four types of GR-bound regions sorted as a function of the TF superfamily they relate to. Colouring is based on the fractional difference between background and target frequencies. (e) Motif localisation density in the 401 MoMf-GR peaks, depicted as 40 bins of 20 bp.

