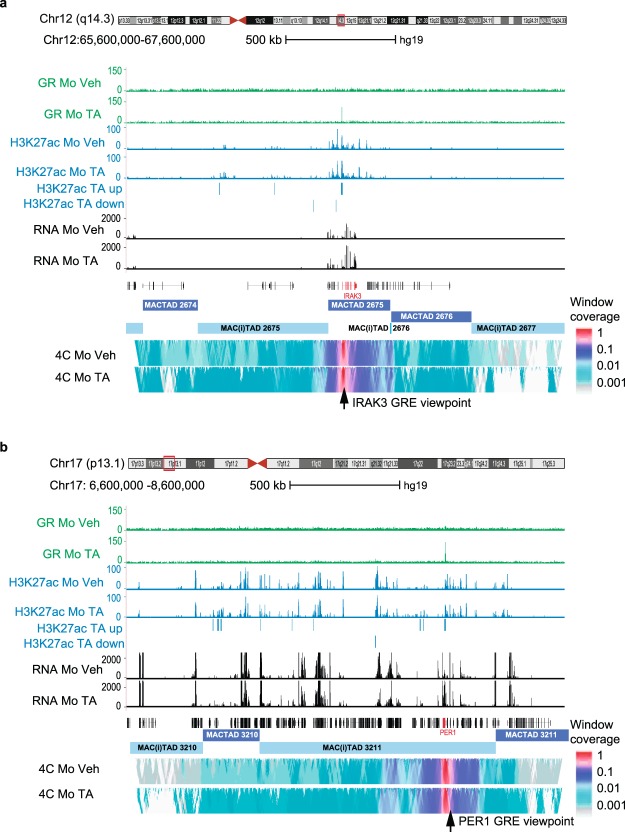
Figure 4.
Circularised chromosome conformation capture using GRE viewpoints. (a) UCSC genome browser screen shot of a 2 Mb segment of chromosome 12q14.3 displaying; in green GR ChIP-seq results in Mo in the absence and in the presence of 1 μM TA, in blue H3K27ac occupancy, and in black RNA-seq data. UCSC transcripts are displayed (IRAK3 is highlighted in red) above the MACTADs and MAC(i)TADs42. The two lower panels display median contact intensities of the IRAK3 promoter GRE viewpoint with DNA in the 2 Mb window. Colouring is according to a normalised logarithmic scale89 in windows of increasing size (2 kb–50 kb from top to bottom). Note the asymmetry of the signal distribution relative to the viewpoint, which spans a region that rather accurately delineates MACTAD 2675 computed by Javierre et al.42. (b) As (a) but for the GRE located 2 kb upstream of the PER1 gene transcription start site.

