Figure 5.
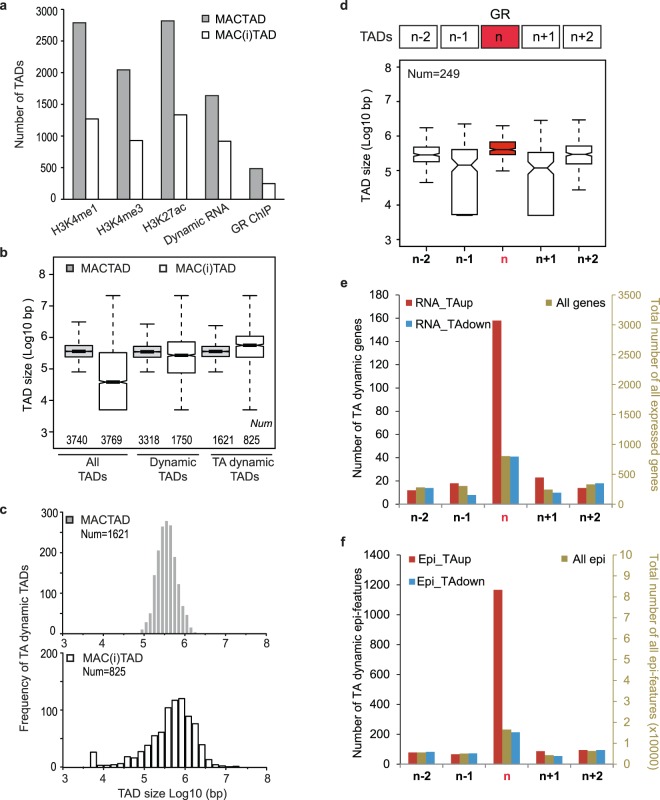
Adjacent TAD analyses. (a) Total number of MACTADs and MAC(i)TADs harbouring dynamic epigenetic regions, RNAs and GR peaks. (b) The first pair of box plots show the size distribution of all 3470 MACTADs delineated by Javierre et al.42 and of the intervening 3769 MAC(i)TADs, including MAC(i)TADs abutting centromeres and telomeres. The middle pair of box plots concerns TADs that harbour any dynamic feature as displayed in panel (a), and the third pair of box plots only concerns TADs bearing TA-induced features. (c) Histogram of the size distribution of the 1621 MACTADs and of 825 MAC(i)TADs bearing TA-responding features. (d) Schematic representation and size-distributions of 249 sets of four TADs that do not harbour any GR peaks themselves and that flank 249 TADs bearing at least one of the 401 MoMf-GR peaks depicted in Fig. 3b. (e) Total number of RNAs (right y-axis) and of TA-up-, and TA-down-regulated mRNAs (left y-axis) in the GR-bearing TADs and in the 249 sets of four neighbouring TADs. (f) Total number of epigenetic features (right y-axis) and of TA-up-, and TA-down-regulated histone H3-bearing epigenetic features (left y-axis) plotted as for (e).

