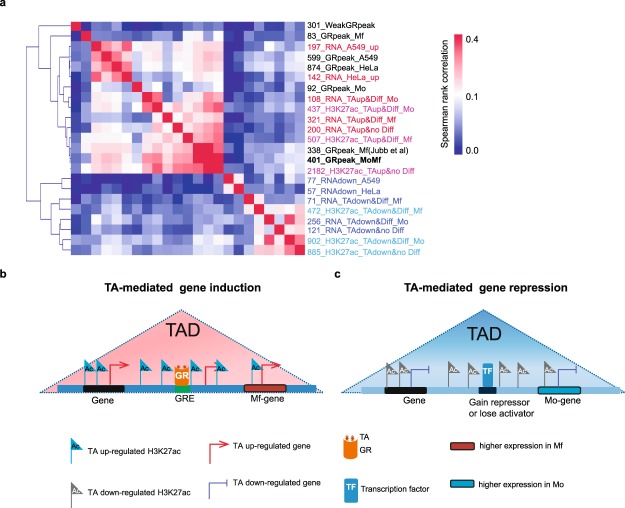
Figure 6.
Correlation heat map of RNA partitions, GR and epigenetic marks based on assignment to TADs. (a) The data presented in Figs 1–3 and RNA-seq and GR-ChIP data for HeLa21, and for A54922 cells were assigned to TADs. Pairwise Spearman correlations were calculated and used to hierarchically cluster the data types. The colour scale renders Spearman correlation values. Red and blue text labels indicate respectively, up- and down-regulation by TA. Black text indicates GR ChIP-seq data sets. Numbers report the absolute number of features encompassed by each data set. (b) Schematic model of gene induction by TA in Mo. The right-most gene is representative of cluster 3 (Fig. 1e). (c) As (b) but for TA-repressed genes. The left-most gene is repressed by TA in both Mo and Mf. The more common expression pattern concerns genes more expressed in Mo. The right-most gene is representative of cluster 5 (Fig. 1e).

