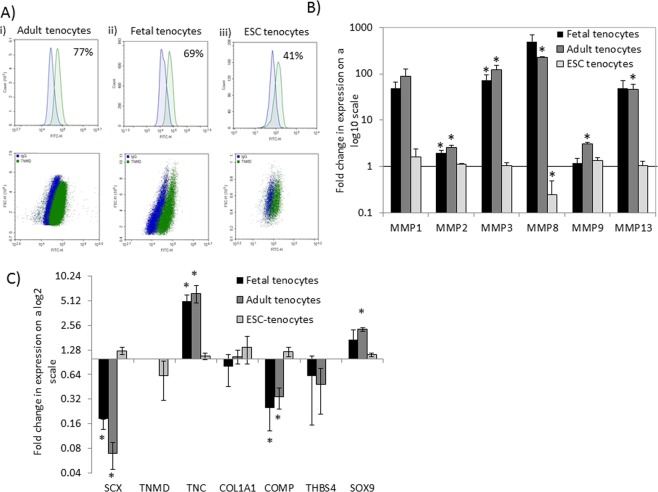
Figure 1.
IL-1β exposure of adult, fetal and ESC-tenocytes results in different gene expression responses. (A) Representative flow cytometry histograms and dot plots of TNMD expression from three biological replicates of (i) adult, (ii) fetal and (iii) ESC-tenocytes cultured in 2D. Blue represents isotype control, green represents TNMD. (B,C) Fold change in gene expression in fetal, adult and ESC-tenocytes following IL-1β exposure for 72 h compared to control cells (fetal, adult or ESC-tenocytes not exposed to IL-1β) on a log scale. Error bars represent the s.e.m. of three independent biological replicates. *p < 0.05 using an unpaired Student’s t-test.

