Fig. 2.
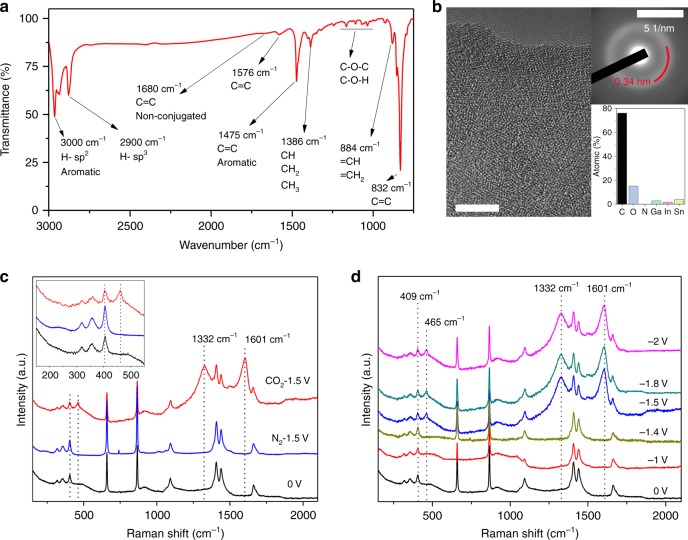
Characterisation of carbonaceous materials. a Fourier transform infra-red (FTIR) spectrum of the isolated carbonaceous materials, featuring intense FTIR absorption lines at 832 and 1475 cm−1 which are characteristic of C=C bonds. b High-resolution transmission electron microscopy (HRTEM) image of isolated layered carbonaceous materials (scale bar, 5 nm), with selected area electron diffraction (SAED) image (inset, scale bar 5 1/nm) and elemental composition determined by EDS (inset). c Raman spectroscopic measurement of carbonaceous materials on a liquid galinstan alloy containing 3 wt% Ce (LMCe3%) surface after electrochemical reduction in CO2 and N2 saturated electrolytes measured at 0 and −1.5 V vs. Ag/Ag+. Inset: magnified view of the Raman peaks at 409 and 465 cm−1. d Operando Raman spectra of the LMCe3% surface during electrocatalysis at indicated potentials

