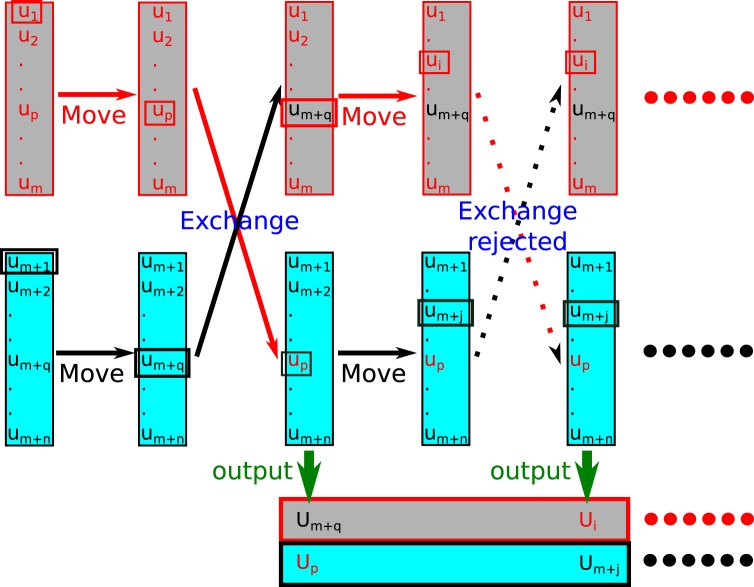
Figure 1.
An illustration of the RE-SWHAM algorithm. This drawing illustrates two replica exchange cycles of the RE-SWHAM method, and shows only two λ-states with “gray” or “cyan” color. In each cycle one data element is chosen from λ-state first, then a replica exchange is performed. In the first cycle since the swap is accepted, the data associated with the two replicas is swapped to the other λ-state’s data array. At the end of each cycle, the data associated with replicas are recorded as the output like explicit RE simulations. Reprinted (adapted) with permission from ref.21. Copyright (2015) American Chemical Society.

