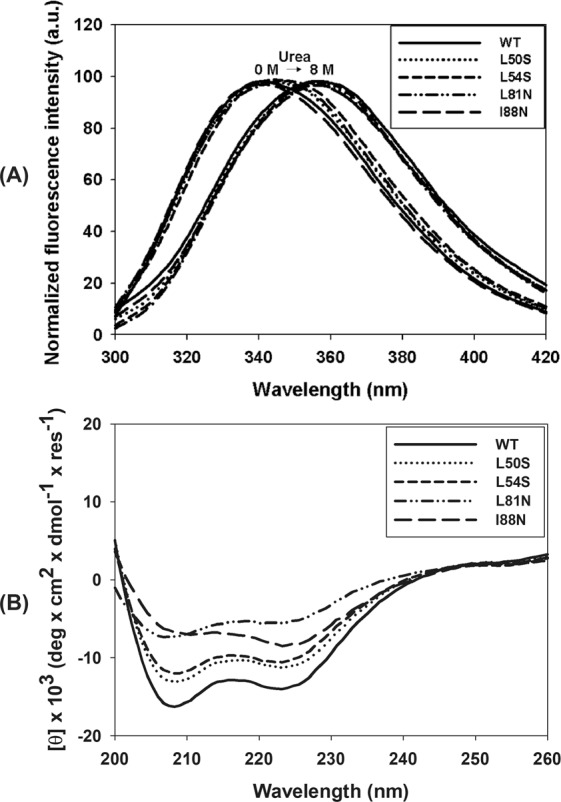
Figure 1.

Analysis of the secondary and tertiary structures of WT and single-point mutant (L50S, L54S, L81N and I88N) DENV2C proteins by tryptophan fluorescence spectroscopy and circular dichroism. (A) Tryptophan fluorescence spectra were obtained by diluting these proteins to a final concentration of 5 µM in 50 mM sodium phosphate buffer (pH 6.0)/0.2 M NaCl. Protein unfolding was evaluated by the addition of urea to final concentration of 8 M. (B) CD spectra were obtained in a Chirascan (Applied Photophysics, United Kingdom) using quartz cuvettes with a 0.01-cm path length at 25 °C. The proteins were diluted in 50 mM sodium phosphate buffer (pH 6.0)/200 mM NaCl to a final concentration of 30 µM. Final spectra were the averages of triplicates after buffer and baseline subtractions and were plotted from wavelengths of 200 nm to 260 nm.
