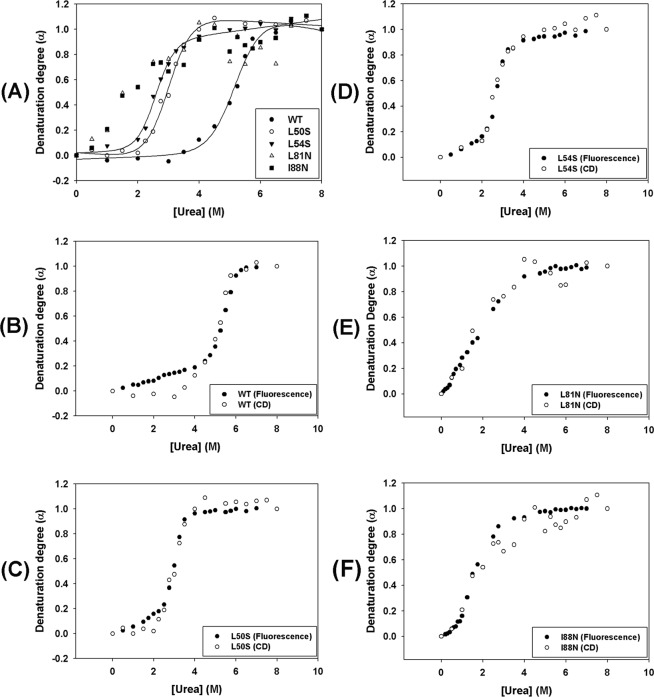
Figure 5.
Urea-mediated denaturation of WT and single-point mutant DENV2C proteins was monitored by CD. CD spectra were obtained in a Chirascan (Applied Photophysics, United Kingdom) using quartz cuvettes with 0.1-cm path length at 25 °C. The proteins were diluted in 50 mM sodium phosphate buffer (pH 6.0)/200 mM NaCl containing urea concentrations ranging from 0 to 8 M to a final protein concentration of 10 µM. The molar ellipticity at 222 nm was converted into denaturation degree (α) and was plotted against the urea concentration (A). The denaturation degree (α) curves using urea obtained for each protein by CD and tryptophan fluorescence were superimposed and are shown in (B–F).

