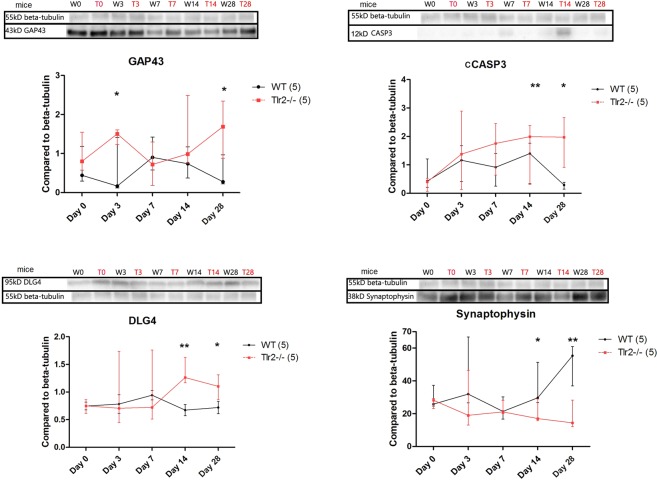
Figure 5.
Western Blot with analysis per time point of WT and TLR−/− showing median and interquartile ranges with statistically significant differences at chronic time points for GAP43 and CASP3, as well as for synaptic markers of DLG4 and synaptophysin. ***,** and *marking P < 0.001, P < 0.01, P < 0.05 for differences between WT controls and Tlr2−/− controls, respectively. The blots shown here were cut from the bigger gel, therefore boxed here, and the full-length blots were provided in Figure S1.

