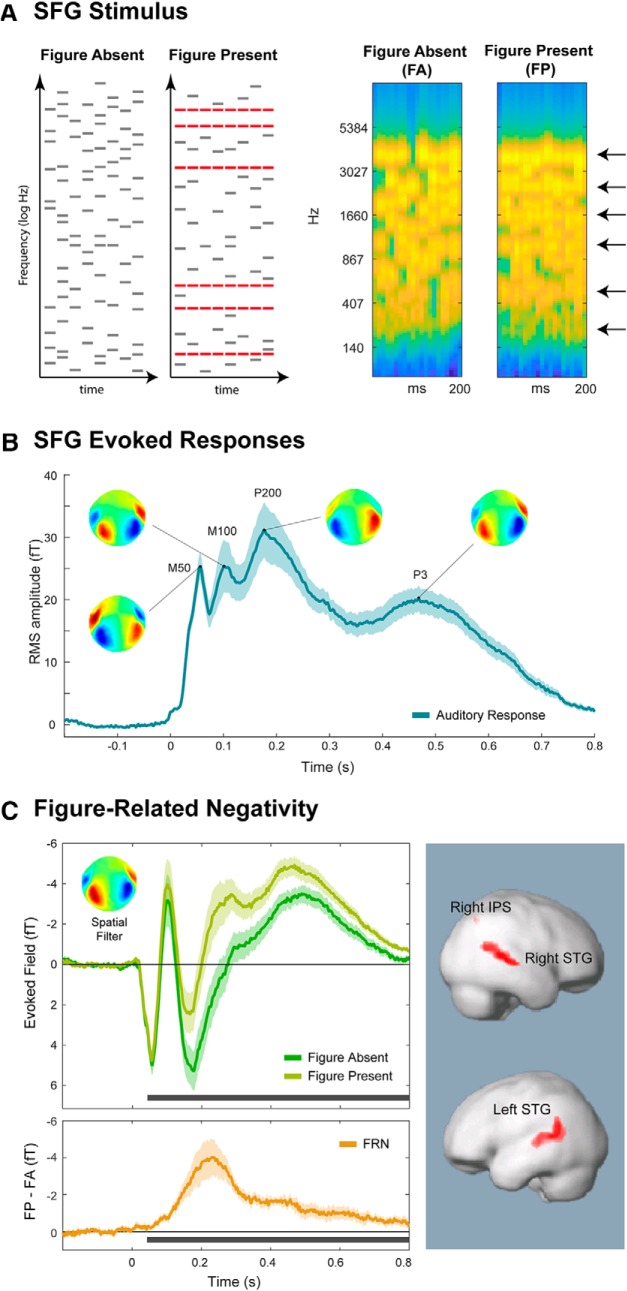
Figure 1.
Stimuli and basic MEG responses under LL (Experiment 1). A, Example schematics (left) and spectrograms (right) of the SFG stimuli. Stimuli, adapted from Teki et al. (2011, 2013), consisted of a succession of brief (25 ms) chords, each comprised of multiple frequency components. The FA stimuli were chords comprised of random frequencies, forming a stochastic background, whereas the FP stimuli were constrained so that a subset of the frequencies, selected randomly for each trial (indicated in red in the schematic representation and by black arrows in the spectrogram), were repeated across chords, producing an auditory “figure.” The associated percept is that of a bound auditory object that is segregated from the random ground (Teki et al., 2013). Stimulus examples are given in Figure 1-1. The spectrograms were generated with a filterbank of 1/equivalent rectangular bandwidth wide channels (Moore and Glasberg, 1983) equally spaced on a scale of equivalent rectangular bandwidth rate. Channels are smoothed to obtain a temporal resolution similar to the equivalent rectangular duration (Plack and Moore, 1990). This model processing in the auditory periphery produces a representation of the stimulus similar to that available to the CNS. B, The overall response to the SFG stimuli (collapsed over FA/FP conditions) under LL (Experiment 1). Plotted is the mean RMS (instantaneous power) of stimulus-evoked activity collapsed over all conditions. Associated scalp topographies at major peaks are provided. Error bars indicate the Standard deviation of bootstrap resamplings. C, FRN (Experiment 1). Evoked fields calculated using a spatial filter, which maximized the difference between FP and FA responses (inset; see Materials and Methods). Evoked fields in this and subsequent figures are plotted with M100 as an “upward” peak, to match the convention used in Electrocencephalography for its counterpart, N1. Error bars indicate the SD over bootstrap resamplings for each condition. Bottom, Horizontal black bars represent significant differences between the conditions. Top, Evoked responses separately for FP and FA stimuli. Bottom, FRN, calculated by the difference time-series of FP − FA. Right, Source-level contrast. Red represents regions where FP trials showed greater activity than FA trials. No regions were found to be significant for the opposite contrast (FA > FP).

