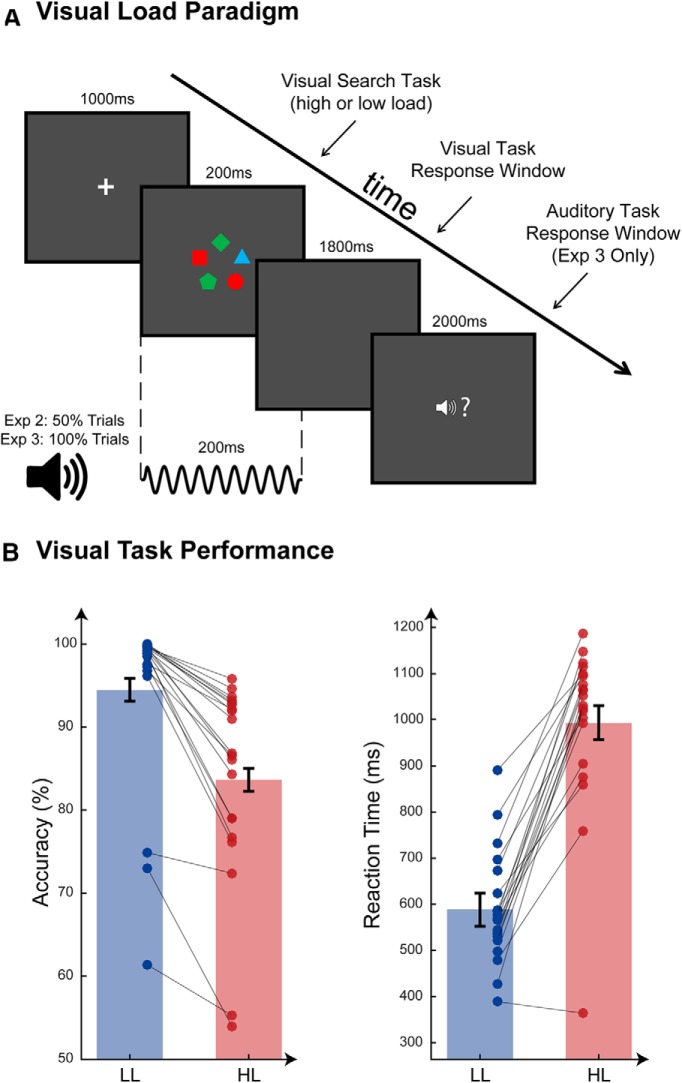
Figure 2.
Experiment 2: visual load task. A, Load task paradigm used in Experiments 2 and 3. The LL task was a color feature search, whereas the HL task was a color-shape combination search. Auditory stimuli occurred on 50% of trials in Experiment 2 (MEG) and 100% of trials in Experiment 3 (behavioral dual task). When present, auditory stimuli occurred at precisely the same time as the visual search array. The response window for the auditory target was displayed only during Experiment 3 when there was an active auditory task. B, Visual task behavioral data from Experiment 2 (MEG). Mean values for accuracy (percentage correct) and RTs are plotted for LL (blue bars) and HL (red bars). Error bars indicate the Standard Error of the sample mean, corrected to reflect the within-subjects contrast. Individual data are plotted and connected by gray lines to illustrate change in performance for each participant between LL and HL conditions.

