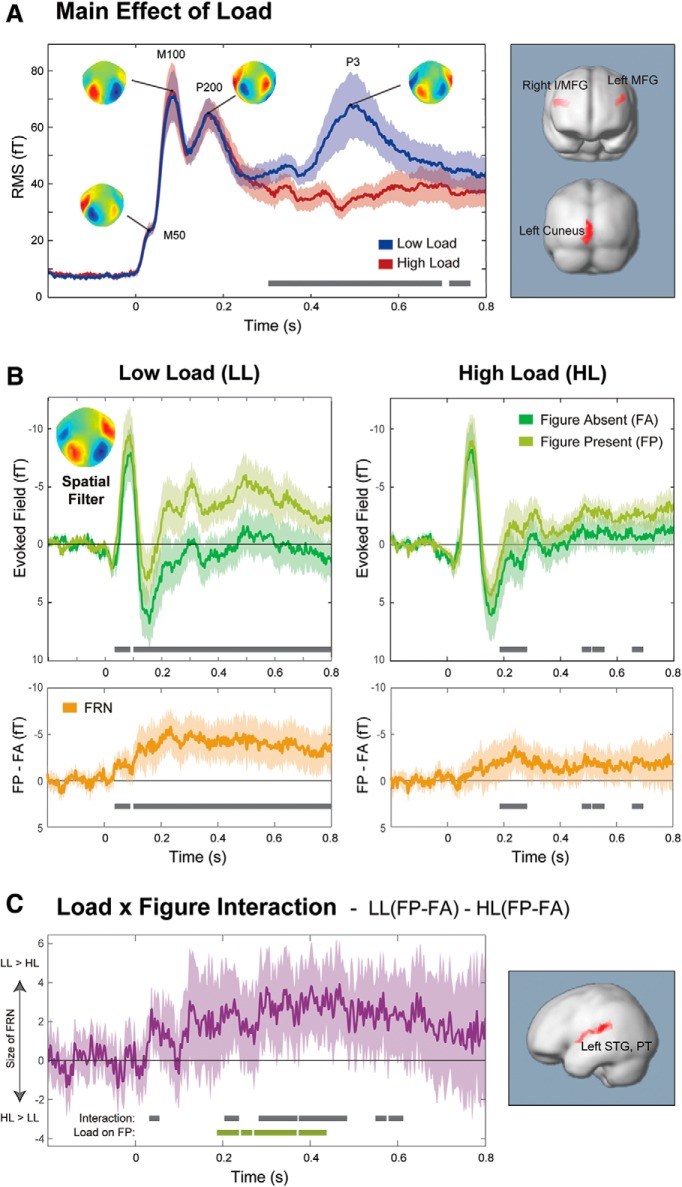
Figure 3.
Experiment 2: effect of load on figure-ground segregation. A, Overall response to the SFG stimuli (collapsed over FA/FP conditions) as a function of load. Mean RMS (instantaneous power) of responses to auditory stimuli (collapsed over FP and FA trials) in Experiment 2 under LL and HL, with scalp maps of peak topographies. The topographies are characteristic of auditory activity (symmetric dipolar pattern over temporal sensors), confirming that the source separation analysis was successful at isolating auditory activity. Error bars indicate the SD of bootstrap iterations for each condition. Bottom, Horizontal black bars represent significant differences between the conditions. Right, Regions where activity was stronger under LL than HL. No regions were found to be significant in the opposite direction to that displayed. B, FP/FA responses as a function of visual load. Evoked fields illustrating the FRN separately under LL (left) and HL (right) conditions. Top, Evoked responses separately for FP and FA stimuli. Bottom, FRN explicitly, calculated by the difference time-series of FP-FA. Inset, Spatial filter used to calculate the responses (see Materials and Methods). Error bars indicate the SD of bootstrap resamplings for each condition. Bottom, Horizontal black bars represent significant differences between the conditions. C, Interaction between load and FP/FA. The difference time-series, LL(FP − FA) − HL(FP − FA), quantifies the interaction between load and figure. Error bars indicate 2 SD of the bootstrap, for comparison with zero line. Black bars represent periods when the values differed significantly from zero. Green bars represent periods when load had a significant effect on responses to FP stimuli (no significant periods were found for the effect of load on FA responses). Right, Regions where the source analysis showed a significant interaction between responses in LL versus HL and FP versus FA.

