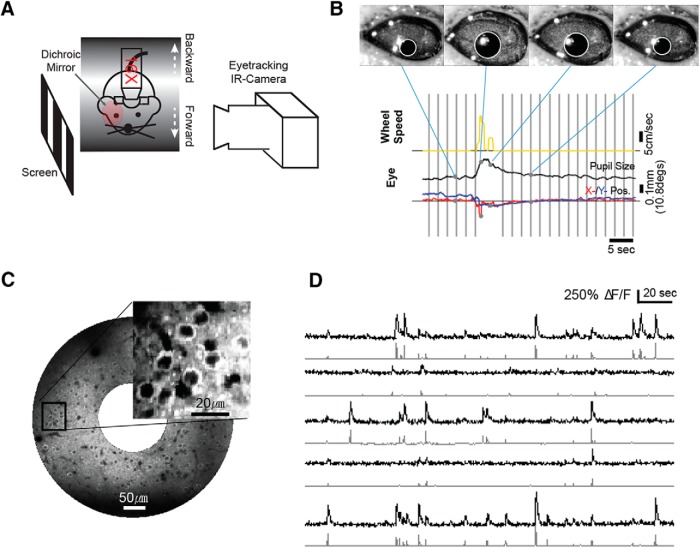
Figure 1.
Experimental setup. A, Schematic of experiment setup for awake and sedated animals. Eye tracking was performed for awake animals. B, Monitoring of behavioral state during visual stimulus presentation. Top, Single frames of the pupillometry acquisition video at four time points during the experiment. Bottom, Time-series plots of pupil radius (black), pupil position (x, red; y, blue), and wheel rotation speed (yellow). Gray shades represent the stimulus presentation period of the trials selected for the analysis (trials occurring during movement were excluded; see Materials and Methods). C, Mean fluorescence image from a FOV that expresses GCaMP6s. Inset, Enlarged view from the indicated rectangle. D, Examples of fluorescence traces (top) and corresponding deconvolved spike train activity (bottom).

