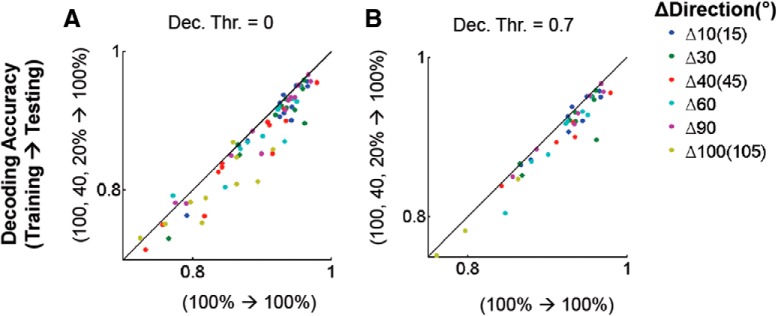
Figure 12.
Suboptimal decoding performance of contrast-independent direction decoders. A, Decoding performance between contrast-specific (x-axis) versus contrast-independent (y-axis) decoders. Each dot depicts decoding accuracy from each pair of directions in a FOV (n = 12). Friedman test p < 0.05. B, Decoding performance comparison presented only for pairs for which within-contrast decoding accuracy was >0.7 at all three contrasts. This suggests that the weaker performance of contrast-independent decoders compared with contrast-specific decoders did not result from poor signal-to-noise data entering at low contrasts. Wilcoxon signed rank test p < 0.005. Decoding accuracy for the surviving pairs was normalized with (Contrast-independent − Within-Contrast)/Within-Contrast for each pair of directions and averaged across pairs of directions within each FOV before the statistical test.

