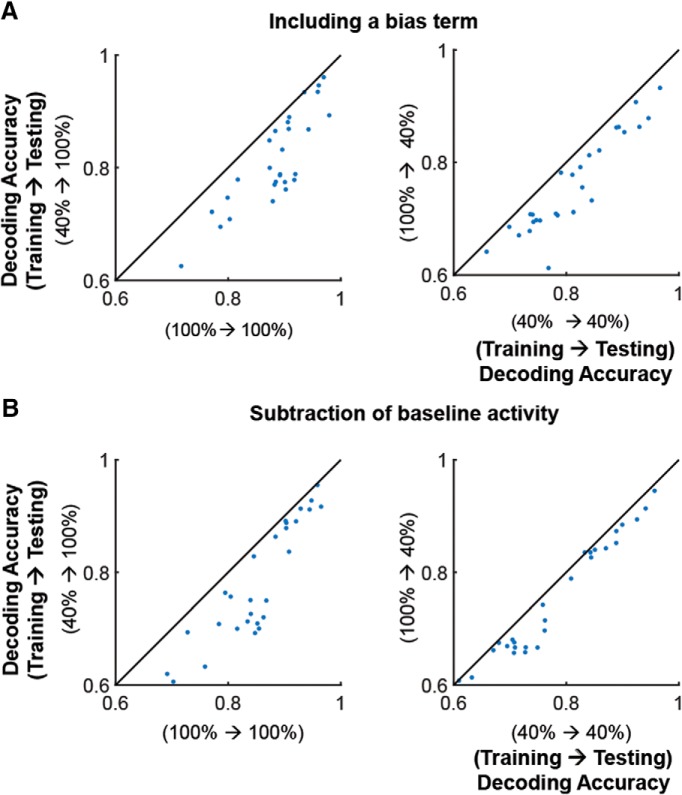
Figure 13.
Better performance of within-contrast decoders does not result from using the specific linear model stated in Equation 3. A, Decoding performance of within-contrast (x-axis) versus cross-contrast (y-axis) decoders by using a linear decoder including a bias term of b in the linear model σ(wTr + b) (see the difference from Eq. 3). B, Decoding performance of within-contrast (x-axis) versus cross-contrast (y-axis) decoders after subtracting baseline activity before visual stimulation from visual response in single trials/cells. Left, Testing contrast 100%. Right, Testing contrast 40%. Each dot indicates average decoding accuracy across all pairs of stimulus directions. Statistical test, Wilcoxon signed rank test. p < 5e−6 for all the cases.

