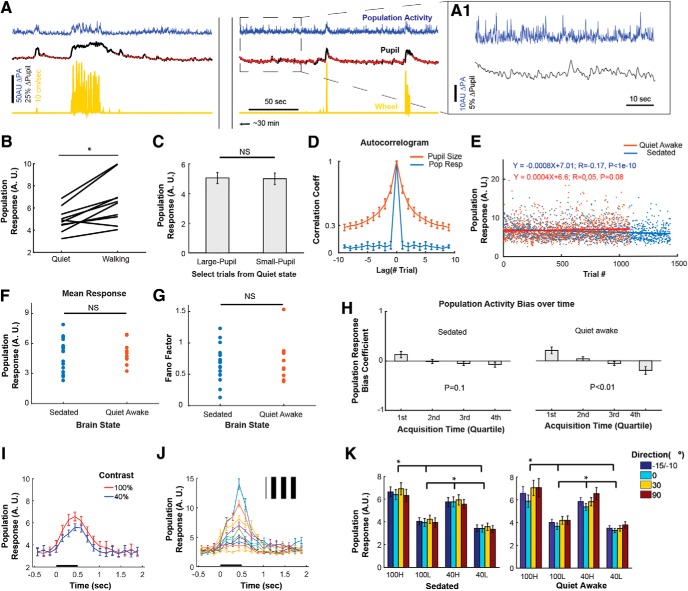
Figure 2.
Modulation of neuronal population response by spontaneous internal input and by stimulus contrast. A, Example of population activity (PA; blue), pupil radius (black), and locomotion speed (yellow; forward/backward: ±) during visual stimulation lasting ∼40 min. Red dots over pupil traces denote trials included in the analysis, during quiet awake state. The arbitrary unit (a.u.), which denotes spike rates, is commensurate with the percentage dF/F (Eq. 1). The pupil size radius is normalized to the horizontal eyelid length. PA is clearly modulated during physiological changes such as locomotion or pupil dilation. PA is also modulated in absence of overt behavior changes as shown in the dashed rectangle, shown in expanded from in A1. B, Population response to visual stimulation during quiet versus walking states (>20 cm/s). p < 0.01, Wilcoxon signed rank test. C, Population response to visual stimulation during “large” versus “small” pupil size. The pupil size for each trial was defined as the mean pupil size during visual stimulation of the trial. Large versus small pupil trials consist of the trials that belong to the upper versus the lower half of the distribution of pupillary radius across trials, respectively. Note that pupillary changes are compared only for periods of quiet wakefulness (see Materials and Methods). Not significant in Wilcoxon signed rank test. D, Autocorrelogram of pupil size and population response across trials only for quiet wakeful periods. The autocorrelogram was calculated after subtracting the mean of each signal. Mean ± SEM across awake sessions (n = 10 FOVs) for B–D. E, Example of population responses over trials from a sedated and an awake animal, respectively. During both the brain states, population responses spontaneously fluctuate in a similar extent (i.e., ∼ 5–10 a.u. and few >10 a.u.) and stable over trials (i.e., very small temporal decay). F–H, Comparison of PA during sedation (n = 18) versus quiet wakefulness (n = 10) periods. Mean population response (F) and Fano factor (G). Wilcoxon rank sum tests are used in F and G. H, Population response bias as a function of acquisition time. x-axis: quartile in acquisition time. y-axis: 1 and −1 represent complete-biases by having all trials within each quartile with high and low population activity levels (high: 50% largest trials; low: the remaining), respectively. 0 denoted un-bias between high versus low PAL. Statistical test: Kruskal–Wallis test. Mean ± SEM (n = 18, 10 FOVs for sedated and awake sessions). The maximum mean bias within each acquisition quartile is <0.2, reflecting small changes of population response over time. I, Mean population response to stimulus contrast in a single FOV. The mean population response was obtained by averaging the responses of all visually responsive neurons across all the trials for each contrast, regardless of stimulus direction. Mean ± SEM. J, Illustration of the large trial-to-trial variation in the population response to one stimulus (i.e., 0°, 100% contrast; inset), from the same population shown in I. Each color-coded line represents a population response, averaged across every 10 trials after ranking single-trial population responses by amplitude. Mean ± SEM (n = 10). K, Mean population response amplitudes (a.u.) as a function of contrast (100 vs 40%) and population response level (high vs low). p < 5e−5 in Kruskal–Wallis Test after averaging across stimulus directions. *p < 0.05 in post hoc Tukey tests. Mean ± SEM (n = 18, 10 FOVs for sedated and quiet awake states, respectively).

