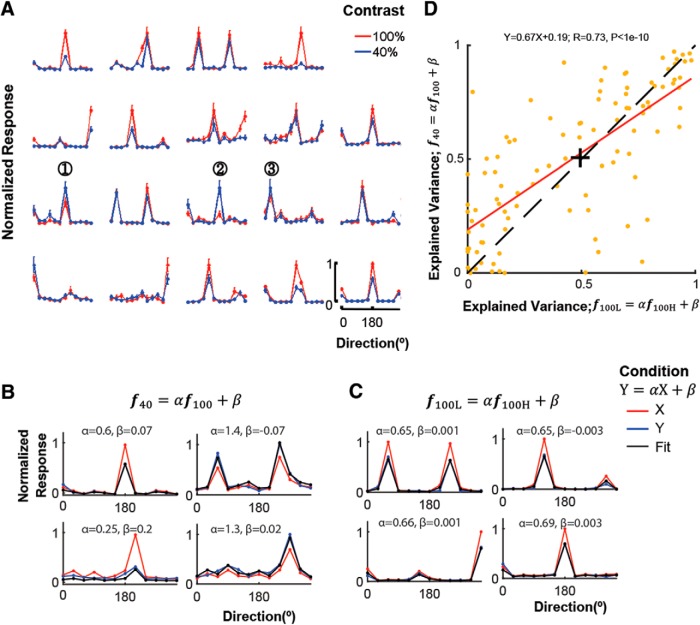
Figure 3.
Linear fits of direction tuning function at 100% versus 40% contrast and high versus low population activity (PA). A, The change in gain of direction tuning functions as a function of stimulus contrast is heterogeneous across cells. Red and blue lines show 100%- and 40%-contrast direction tuning curves normalized by the maximum response at 100% contrast for each cell separately. Mean ± SEM (n = 30 trials/direction). Note that while the preferred direction of cells is well preserved across contrasts, the relative scale of the response (gain) between contrasts varies widely across cells. See for example Cells 1–3 whose responses to lower contrast are higher than to 100% contrast supporting. B, C, Fits (black) predicting the direction tuning functions at 40% contrast (f40; blue) from the ones at 100% contrast (f100; red) and at L (f100L; blue) from H (f100H; red), respectively. Such fits are used to extract the parameters α and β. Left, α < 1; right: α >1 for B. α = ∼0.65 for the four example cells for C. D, Tuning invariance across contrasts versus across high and low population activity. The higher the explained variance, the higher the similarity of tuning (extent of tuning invariance) across the two conditions. Although these mechanisms of gain modulation are different, they show a similar tuning invariance pattern across cells: cells showing strong tuning invariance with contrast changes (high EV across contrasts) also show strong tuning invariance with PAL changes (high EV across different population levels of activity). +The point corresponding to the median of the samples. The dashed line denotes y = x.

