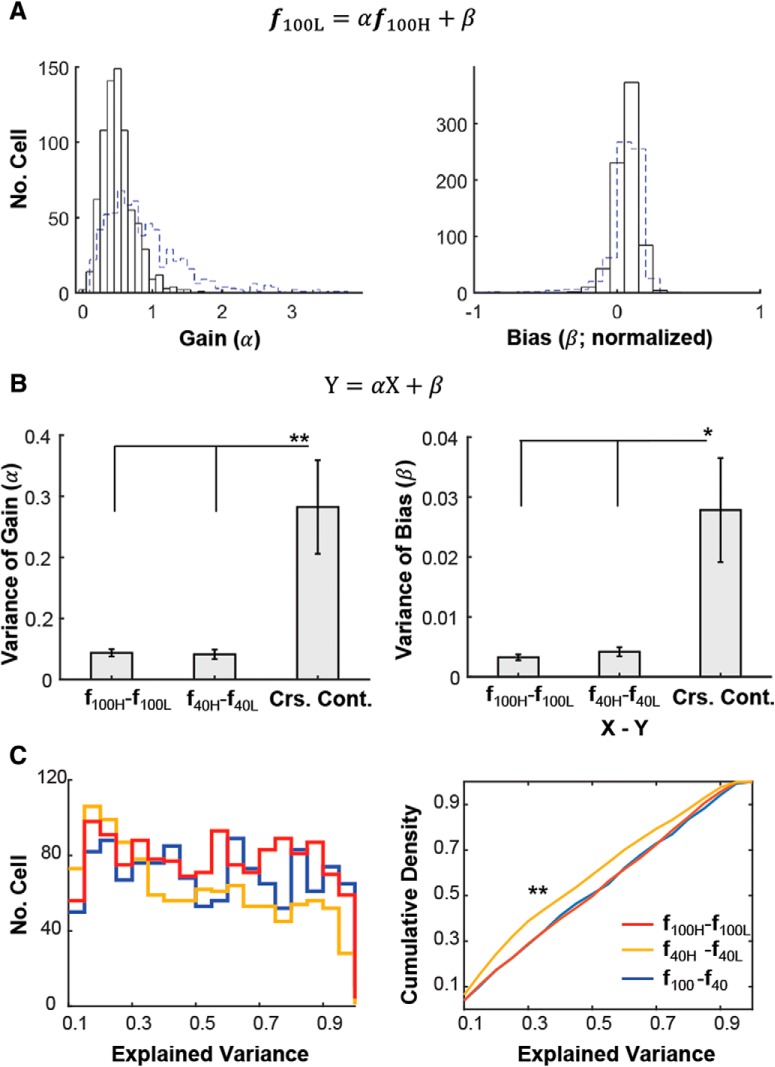
Figure 5.
Spontaneous internal gain modulation and its comparison to contrast gain modulation. A, Distribution of gain (α) and bias (β) of all cells across FOVs (n = 747 from 28 FOVs) in the linear fit of f100L = αf100H + β: α (left) and β (right). β was normalized to the maximum tuning response at 100H (i.e., 100% contrast and high population activity). Blue dashed lines represent the histogram shown in Figure 4 (i.e.,α and β; f40 = αf100 + β). Only cells whose fits had explained variance >0.5 were included. For f100L = αf100H + β (black) versus f40 = αf100 + β (blue dashed line), variances of α s are 0.44 versus 0.05, and variances of β are 0.016 versus 0.006, respectively. p < 1e−30 for α and p < 1e−10 for β in Kolmogorov–Smirnov test. B, Variance of gain (α) and bias (β) modulations across cells within each FOV, arising as a result of a change in population activity level (i.e., f100H − f100L, f40H − f40L) versus stimulus contrast (Crs. Cont.). Crs. Cont., The average variance derived from cross-contrast-fits (i.e., f100H − f40H, f100H − f40L, f40H − f100L, f100L − f40L). Only cells whose fits had explained variance >0.5, which is approximately the median of both EV distributions shown in Figure 3D, were included for both fittings of f100H − f100L and f40H − f40L. Mean ± SEM (n = 26 FOVs). p < 5e−4 and p < 1e−3 for α and β in Kruskal–Wallis test, respectively. *p < 1e−2 and **p < 1e−3 in post hoc Tukey tests, respectively. Note that high ↔ low internal activity fluctuations lead to more homogeneous gain modulations across the L2/3 cell population than changes in stimulus contrast. C, Histogram (left) and cumulative density function (right) of explained variance of the linear fits. Blue: f100 − f40; Red: f100H − f100L; Yellow: f40H − f40L. **p < 1e−5 by Kolmogorov–Smirnov test. Only samples with EV > 0.1 are included in the plot. The similarity between f100H − f100L and f100 − f40 suggests that the different profiles of gain modulation shown in A and B are not because of a difference in tuning-shape invariance of individual cells, nor the exact value of the criterion (EV > 0.5) used to select cells. Even though the fits of f40H − f40L (C left) degrade somewhat at high EV bins, resulting in a CDF for f40H − f40L that is statistically different from the ones for f100 − f40 and f100H − f100L, selected cells with EV > 0.5 still have smaller variance of gain and bias modulation for f40H − f40L (as shown in B). Number of cells selected (with EV > 0.5) was as follows: 24% (496) versus 32% (655) cells for f40H − f40L and f100 − f40, respectively. Note that our conclusions remain robust to reasonable shifts of the EV threshold used for cell selection.

