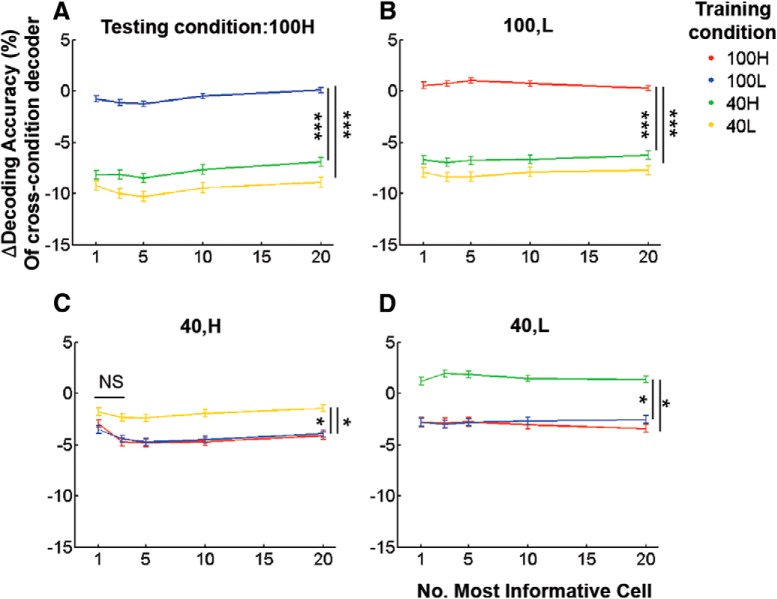
Figure 9.
Decoding performance degrades for changes in contrast, but not for changes in population activity. A–D, Relative performance of cross-condition decoders generated using the first n most informative cells, as a function of n. Y-axis plots change in decoding accuracy: (cross-condition − within-condition)/within-condition. Illustrated differences are significant for all n, except for n = 1,3 in C: Kruskal–Wallis test, p < 1e−7 for A and B, p < 0.05 for C and D. *p < 0.05, ***p < 1e−5 by post hoc Tukey tests.

