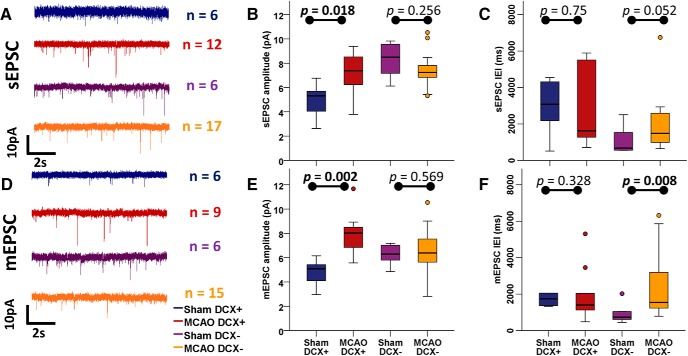
Figure 5.
Glutamatergic synaptic input onto DCX+ neurons is increased following stroke. A, Representative traces of sEPSC input (recorded at −82 mV in the presence of 10 μm PTX) onto granule cells. B, C, Distribution of sEPSC amplitudes (B) and IEIs (C) onto granule cells. DCX+ neurons show significantly increased sEPSC amplitudes, and no change in IEI after MCAO, whereas sEPSC input onto DCX− neurons does not change in either amplitude or IEI following MCAO. D, Representative traces of mEPSC input (recorded at −82 mV in the presence of 10 μm PTX and 1 μm TTX) onto granule cells. E, F, Distribution of mEPSC amplitudes (E) and IEIs (F) of granule cells. DCX+ neurons show significantly increased mEPSC amplitudes, and no change in frequencies after MCAO, whereas mEPSC frequency decreases (IEI increases) in DCX− neurons following MCAO. See also Table 3 for statistical results.

