FIGURE 5.

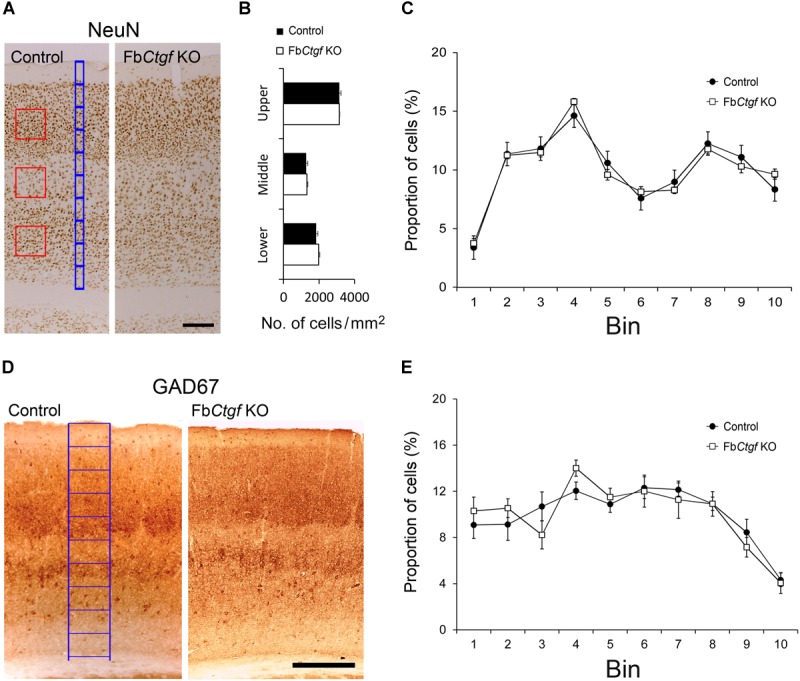
Density and distribution of neurons in the somatosensory cortex. Neurons were labeled with pan-neuronal markers, NeuN (A). Counting squares of 200 μm × 200 μm (red squares) were given to the upper (layers II–IV), middle (layer V), and lower (layer VIa) regions of the cortex. The densities of NeuN-positive neurons in the cortex were estimated in control and FbCtgf KO mice (B). The distribution of cortical neurons was measured using 10 counting bins of 50 μm in width (blue bins) from the pia surface to the edge of the white matter. In this system, from the top, bin 1 roughly corresponds to cortical layer I, bins 2–3 to layer II/III, bin 4 to layer IV, bins 5–7 to layer V, and bins 8–10 to layer VI, respectively. The distributions of NeuN-positive neurons were similar between control and FbCtgf KO mice (C). Inhibitory neurons in the somatosensory cortex were revealed with GAD67 immunostaining (D). The distribution of inhibitory cortical neurons was measured using 10 counting bins of 150 μm in width (blue bins) from the pia surface to the edge of white matter. The distributions of GAD67-positive neurons were similar between control and FbCtgf KO mice (E). Scale bars are 200 μm. n = 5 in each genotype. Results are means ± SEM.
