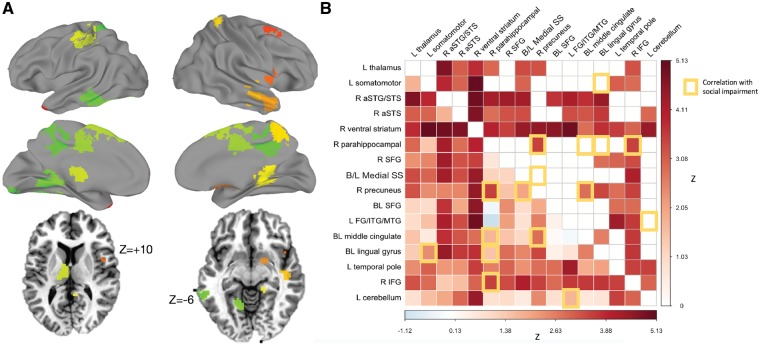
Figure 2.
Group (Autism > Control) comparison of inter-region correlations across tasks. (A) Regions of interest defined by the main effect of Group plotted on standard surfaces. Axial slices provided to show thalamus and ventral striatum regions. (B) Region-by-region matrix indicating strength of effect of autism versus control. A main effect of Group (Autism versus Control) was tested on region-by-region correlation levels. Overall, autism participants showed increased correlation between regions during the social interaction tasks, relative to controls (lower triangle unthresholded, upper triangle FDR corrected to q < 0.05). Increased functional connectivity was correlated with more extensive social impairment measured by the Social Responsiveness Scale (yellow-outlined squares).

