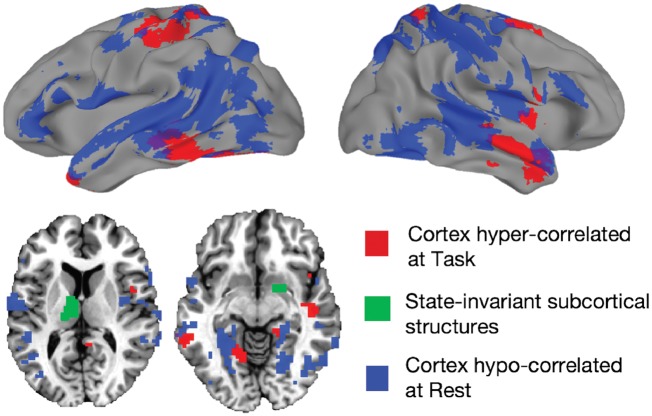
Figure 5.
Regions showing the greatest hyper-correlation at task, and the greatest hypocorrelation at rest. Autism > Control cortical Task-defined regions (red) shown along with the strongest Control > Autism effects in resting state data (blue). The left thalamus and right ventral striatum regions from the present study are coloured green. These subcortical structures showed the greatest state-invariance—with the same differences in correlation with cortex during both task and rest.

